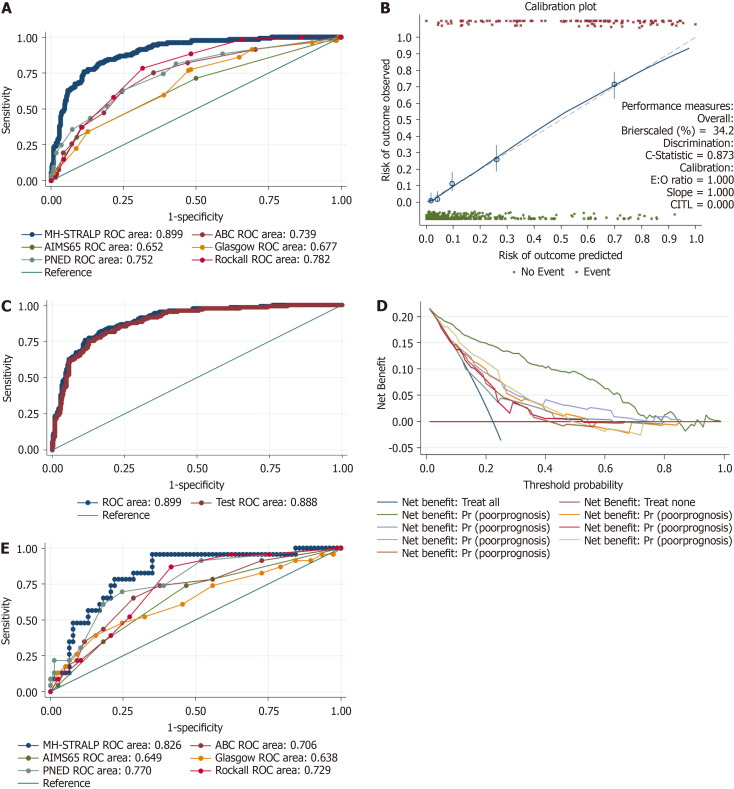
Figure 3.
Performance and validation of the MH-STRALP nomogram. A: The area under the curve (AUC) of the MH-STRALP nomogram for prognostic prediction of upper gastrointestinal bleeding (UGIB) in the training cohort; B: The calibration curve for the prognostic nomogram. The x-axis represents the nomogram-predicted probability and y-axis represents the actual probability of the compound outcomes. A perfect prediction would correspond to the 45° grey line. The brown line represents the entire cohort bias-corrected by bootstrapping (B = 1000 repetitions), indicating observed nomogram performance; C: The AUC of the MH-STRALP nomogram in the internal cross-validation analysis in the training cohort; D: The decision curve analysis compared the accuracy for prognostic prediction between MH-STRALP nomogram and other scoring systems; E: The AUC of the MH-STRALP nomogram for prognostic prediction of UGIB in the validation cohort. ROC: Receiver operating characteristic.

