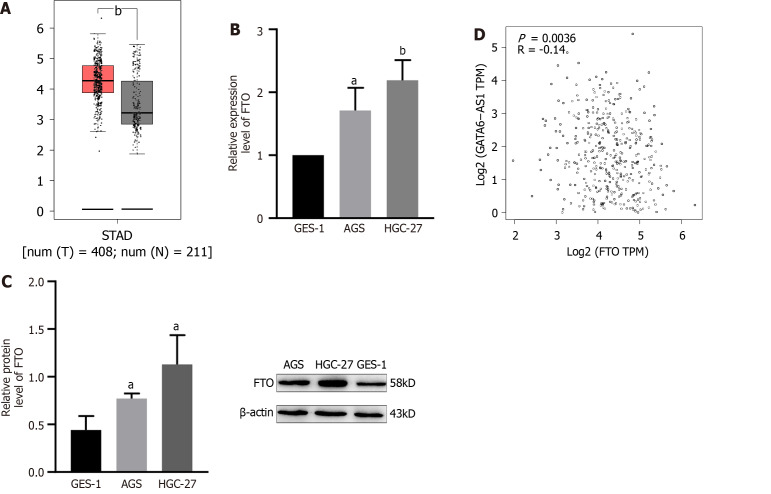
Figure 4.
The expression of fat mass and obesity-associated protein in gastric cancer and its relationship with GATA6-AS1. A: Bioinformatics analysis showed that the expression levels of fat mass and obesity-associated protein (FTO) in gastric cancer tissues were significantly higher than those in normal tissues; B and C: Reverse transcription-polymerase chain reaction and western blotting experiments confirmed that the expression levels of FTO in AGS and HGC-27 gastric cancer cells were higher than those in GES-1 gastric mucosa cells; D: TCGA database analysis revealed that the expression levels of FTO were negatively correlated with GATA6-AS1. aP < 0.05. bP < 0.01. STAD: Stomach adenocarcinoma; Num: Number; T: Tumor tissues; N: Normal tissues; FTO: Fat mass and obesity-associated protein.

