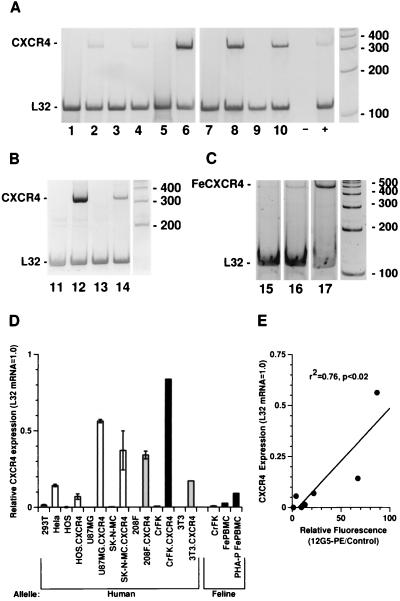
FIG. 6.
Reverse transcription-PCR analysis of human and feline CXCR4 expression. Cell lines stably expressing human CXCR4 are designated by the suffix CXCR4 and were generated by G418 selection after transduction with Moloney murine leukemia virus-based retroviral vector pZ.CXCR4. RNA was isolated, treated with DNase, and analyzed by semiquantitative reverse transcription-PCR for human or feline CXCR4 with internal coamplification of a conserved cellular message (ribosomal protein L32 mRNA). Means of three or more independent measurements are plotted in panel D, while representative gels are shown in panels A to C. (A and B) Reverse transcription-PCR of human CXCR4 (332-bp band) and L32 (120-bp band) for human (open bars in panel D), rodent (shaded bars in panel D), and feline (closed bars in panel D) cells. Lane 1, 293T cells; lane 2, HeLa cells; lane 3, HOS cells (human osteosarcoma); lane 4, HOS.CXCR4 cells; lane 5, U87MG cells; lane 6, U87MG.CXCR4 cells; lane 7, SK-N-MC cells; lane 8, SK-N-MC.CXCR4 cells; lane 9, 208F rat fibroblasts; lane 10, 208F.CXCR4 cells; lane 11, CrFK cells; lane 12, CrFK.CXCR4 cells; lane 13, 3T3 cells; lane 14, 3T3.CXCR4 cells. −, RNA extraction blank; +, repeat HeLa cell positive control. (C) Feline CXCR4 (497-bp band) and L32 (120-bp band) expression. Lane 15, CrFK cells; lane 16, fresh Ficoll-purified F. catus PBMC (FePBMC); lane 17, F. catus PBMC stimulated for 48 h with phytohemagglutinin P in RPMI with 15% bovine serum (PHA-P FePBMC). (D) Expression of CXCR4 RNA plotted relative to L32 mRNA expression for each sample, with subtraction of local background from each window and correction for relative band product sizes. Error bars represent standard deviations of three or more independent measurements. For each sample, PCR was also performed without reverse transcription to exclude any contribution of DNA to products, and no bands were detected (data not shown). (E) CXCR4 mRNA expression, determined above, as described, was plotted against cell surface expression of human CXCR4, expressed as the ratio of mean fluorescence intensity of 12G5-PE stained and unstained control cells. RNA expression was found to be linearly related to CXCR4 expression on the cell surface (r2 = 0.76, P < 0.02).

