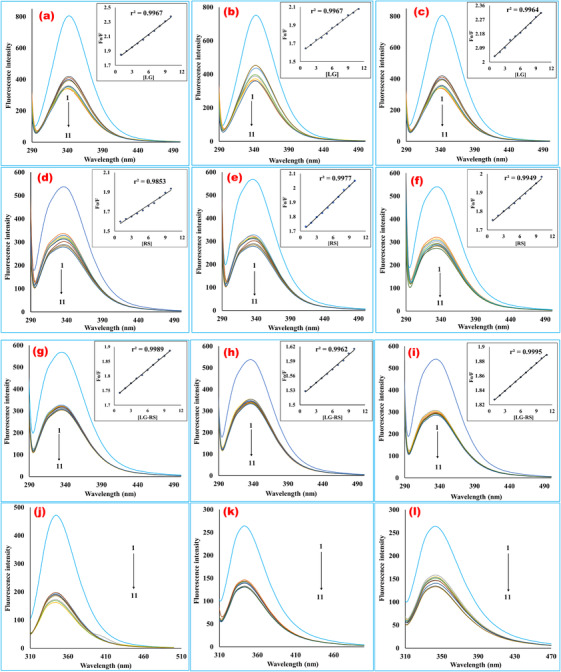
FIGURE 3.

Fluorescence emission spectra of bovine serum albumin in the presence of various concentrations of linagliptin (a‐c), rabeprazole sodium (d‐f), and their 1:1 complex (g‐i) (T = 298, 308, and 318 K, respectively, for each ligand, at 280 nm excitation wavelength). (j–l) The fluorescence emission spectra of bovine serum albumin in the presence of various concentrations of linagliptin (j), rabeprazole sodium (k), and their 1:1 complex (l) at 293 nm excitation wavelength at room temperature. The curves 1–11 indicate the concentrations of 0, 1, 2, 3, 4, 5, 6, 7, 8, 9, and 10 mM, respectively. The concentration of bovine serum albumin was fixed at 0.025% for each fluorescence scanning. The plots contain fluorescence intensity in the Y‐axis, and wavelength (nm) in the X‐axis. The fluorescence intensity of the macromolecule was quenching during the rising concentrations of the ligands in a regular trend. The emission spectra were scanned in the range of 200–500 nm at 280 and 293 nm excitation wavelengths. The interaction media was maintained at physiological pH 7.4 by phosphate buffer. The inset a–i bears BSA quenching Stern–Volmer plots with increased concentrations of linagliptin (a‐c), rabeprazole sodium (d‐f), and their 1:1 formed complex (g‐i) at 298, 308, and 318 K temperatures. The curves were plotted by inputting data of F 0/F in the Y‐axis and the quencher concentrations (1–10 mM) in the X‐axis. From the slope value of the regression line, the Stern–Volmer constant was computed. The quenching rate constant (kq ) was extrapolated from Ksv divided by the average lifetime of the protein (LG, linagliptin; RS, rabeprazole sodium)
