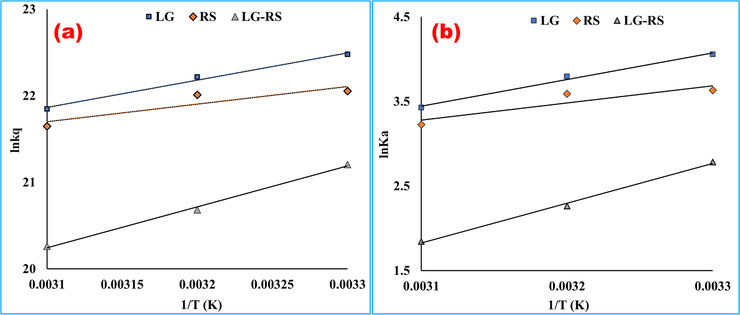
FIGURE 4.

Arrhenius plot (a) and van ’t Hoff plot (b) for the interaction of bovine serum albumin with linagliptin, rabeprazole sodium, and their 1:1 complex at pH 7.4. According to the Arrhenius equation, the activation energy, Ea was computed by using the slope of (a ) [Ea = (–RT) × slope] plotted by imputing ln kq in the Y‐axis and 1/T in the X‐axis. The slope of (b ) was utilized to calculate the difference of enthalpy from the van ’t Hoff equation [∆H = (–RT) × slope], and the intercept value was utilized to measure the entropy change [∆S = R × intercept] (LG, = linagliptin; RS, rabeprazole sodium)
