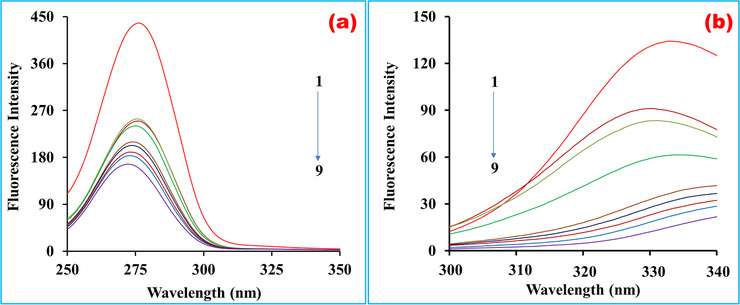
FIGURE 8.

Synchronous fluorescence spectra of BSA solutions (C BSA = 10 µM, T = 300 K, pH 7.4). Curves 1–9 indicated the spectra where the concentrations of linagliptin were 0, 5, 10, 20, 30, 40, 60, 80, and 100 µM, respectively. (a) Δλ = 15 nm and (b) Δλ = 60 nm
