
FIGURE 2.
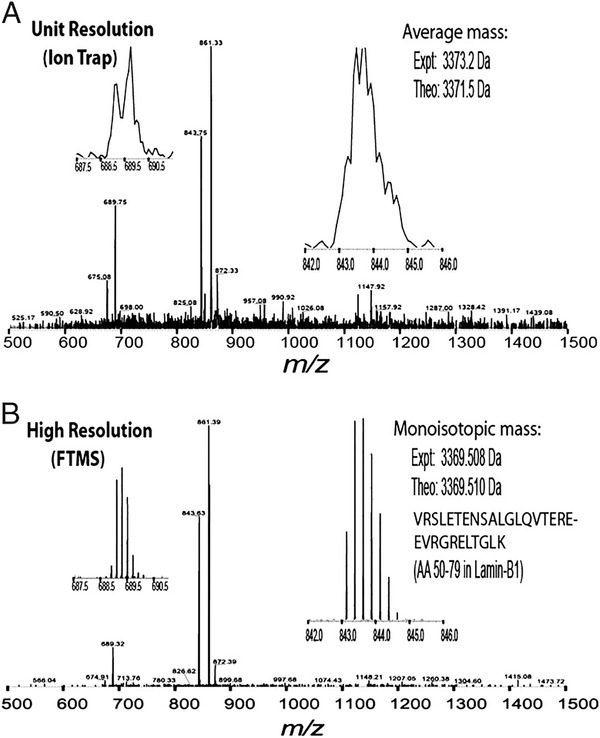
Experimental data of a mixture of peptides analysed at (A) low‐resolution and (B) high‐resolution. Expanded spectra are shown on the sides for individual peptides, where the right inset shows an unmodified Lys‐C peptide that is 30 residues long. The differences seen between these resolutions are clear where at high‐resolution, the natural 13C isotopes are resolved due to the high resolving power, accurate mass measurements to three decimal places are generated that will aid analyte identification and characterisation, and the mass spectrum is visually ‘cleaner’ due to the removal of interferences. On the other hand, the low‐resolution data shows a broad 2 Da peak with an inaccurate experimental average mass, limited isotope information, and a noisy baseline, which will provide low confidence analyte identification. Reprinted with a permission from 24 Copyright (2008) National Academy of Sciences, U.S.A.