
Figure 2.
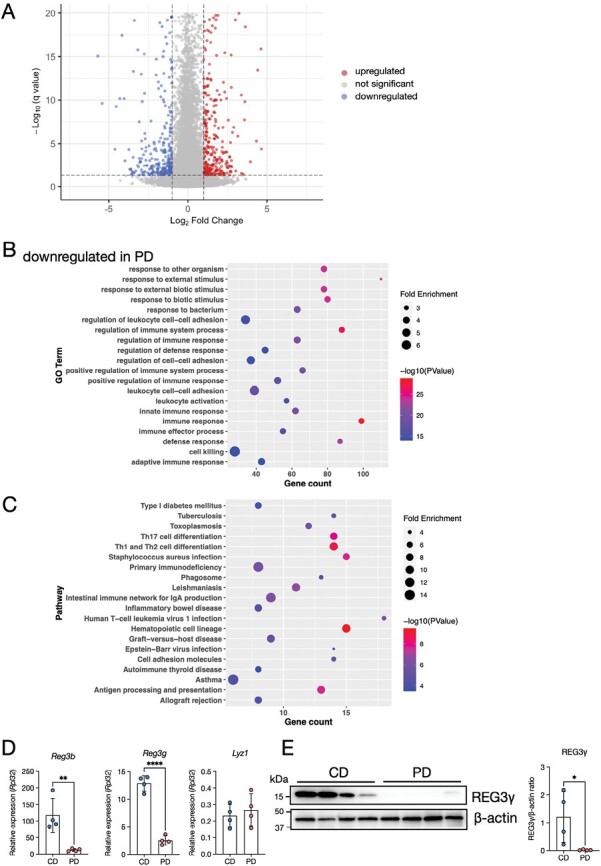
Impact of the PD on the gene expression pattern in the ileal epithelium. (A) Volcano plots comparing the ileal epithelium of CD- vs. PD-fed mice on the basis of RNA-sequencing data. n = 6. Genes up- or downregulated (Log2(fold change) > 1 or q < 0.05) are highlighted. (B, C) Gene ontology (GO) enrichment (B) and Kyoto Encyclopedia of Genes and Genomes (KEGG) pathway analyses (C) of downregulated genes in PD-fed mice. The 20 most significant GO terms are represented in the accompanying bubble plot. Bubble colors represent −log10 (P values). Bubble sizes indicate fold enrichment. (D) Relative mRNA expression of Reg3b, Reg3g, and Lyz1 in the ileal epithelium of CD- and PD-fed mice. n = 4 mice per group. (E) Representative immunoblot of the ileal epithelium from CD- and PD-fed mice for detecting REG3γ and β-actin (loading control). Band intensities were measured using densitometry. n = 4 mice per group. The data represent the mean ± SD. *P < .05, **P < .01, ***P < .001, ****P < .0001. P values were determined by unpaired t-test. CD, crude diet; PD, purified diet.