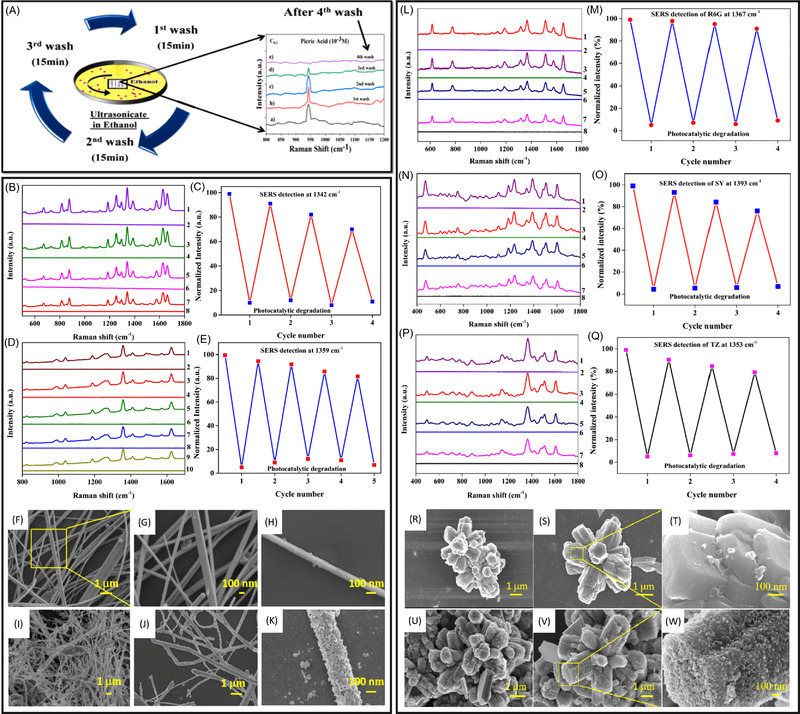
FIGURE 5.

Different reusable SERS substrates cited within this review. (A) Diagram showing the determination of reusability of the developed SERs substrate: laser‐textured Au nanostructures decorated with AuNPs for the detection of multiple hazardous materials (reproduced with permission from Ref. [258]). (F, G, H) FESEM images of silver nanowires developed by Barveen et al., which were used as a template for photoreduction with Au precursor solution, producing AgCl and AuNPs. (I, J, K) FESEM images showing Ag/Au/AgCl heterostructure after a 30‐min photoreduction. (B) and (D) Show the SERS spectra of paracetamol (PCT) and furazolidone (FZD), respectively, adsorbed on the Ag/Au/AgCl structure before and after photodegradation. (C) Using the Raman peak of PCT at 1342 cm‐1 and (E) using the FZD peak of 1359 cm‐1 as the normalized SERS intensity, the retention rates of the Raman peak intensity are shown after several photodegradation cycles for the Raman probe molecules. (C) Shows retention rates for PCT in the second, third and fourth cycles at 91.00, 82.00 and 69.99%, respectively, and (E) shows retention rates for FZD in the second, third, fourth and fifth cycles at 94.4, 91.7, 85.6 and 81.5%, respectively (reproduced with permission from Ref. [259]). From another study by Barveen et al., (R, S, T) show FESEM images of flowerlike ZnO microcrystals and (U, V, W) show the flower‐like ZnO@Ag nanostructures used to detect synthetic dyes rhodamine 6G (R6G), sunset yellow (SY) and tartrazine (TZ). Ag particles were deposited on ZnO after a 30‐ min photoreduction. (L,N,P) Show the SERS spectra of R6G, SY and TZ, respectively, through four cycles of the ‘self‐reviving’ process. (M,O, Q) Show the photocatalytic degradation of the three dyes at characteristic Raman peaks over four cycles, demonstrating the substrate's reusability (reproduced with permission from Ref. [257])
