
FIGURE 4.
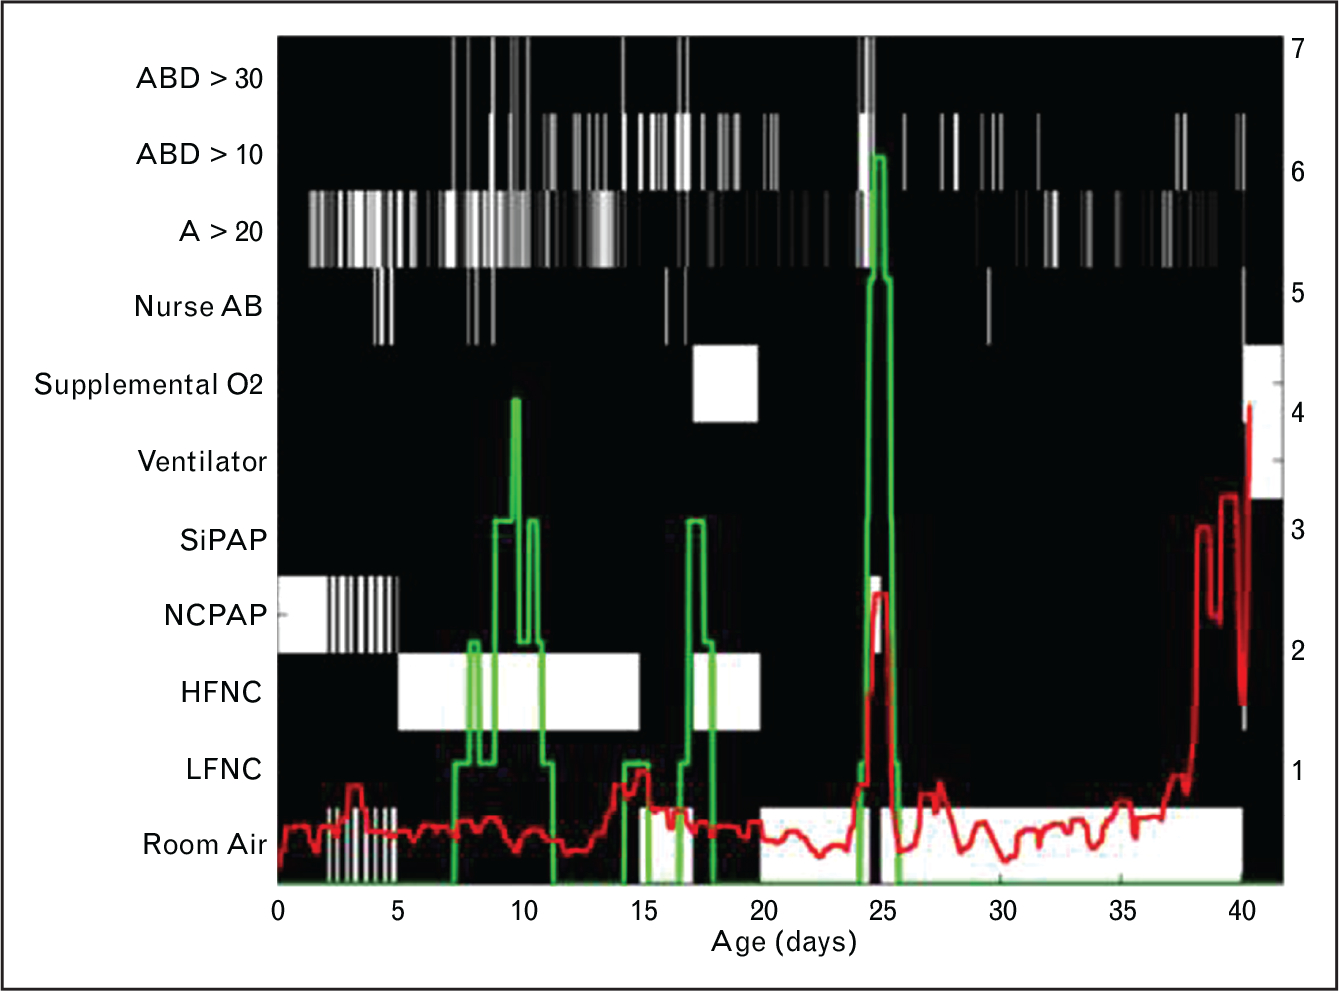
Apnea count and heart rate characteristics index. This map shows the heart rate characteristics (HRC) index (HeRO score, red) and count of 30 s apnea events accompanied by bradycardia and desaturation (ABD30, green) in a preterm infant throughout the NICU stay. The x axis shows days since birth, the left Y axis indicates clinical events (depicted on the map as white or gray boxes), and the right y axis indicates the HRC index or ABD30 count. Note that there are times when a high apnea count and high HRC index coincide, and other times when one occurs without the other. Algorithms incorporating heart rate, respiratory rate, and cardiorespiratory coupling analyses are under development for better predictive monitoring in the NICU.