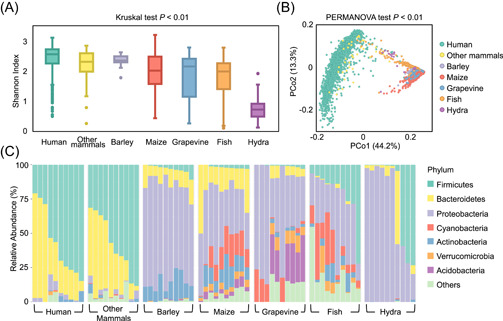
Figure 5.

Meta‐analysis of the microbiome from multiple habitats. (A) Alpha diversity among host types was distinct on the Shannon index. Kruskal test p < 0.01 (p < 0.05 denotes a significant difference). (B) Samples were grouped by habitat in weighted Meta‐Storms distance‐based PCoA pattern. PERMANOVA test p < 0.01 (p < 0.05 denotes a significant difference). (C) Abundant community members varied among different habitat types. PCoA, principal co‐ordinate analysis
