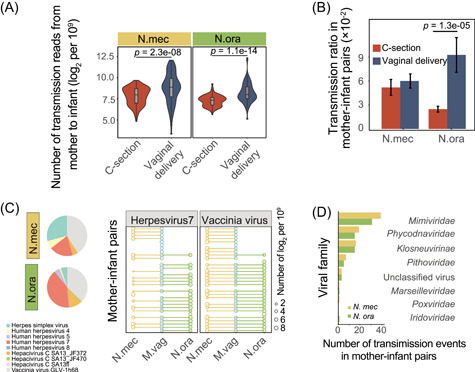
Figure 3.

Transmission of eukaryotic viruses from the maternal vagina to neonatal meconium or oral cavity. (A) Number of metagenomic reads of neonatal meconium (N.mec) and oral cavity (N.ora) samples that could be mapped to the eukaryotic virus contigs of the maternal vagina, respectively. The read count is normalized to 109 and log2‐transformed. Violins show median (black horizontal line), quartiles (gray box), and kernel density estimation (violin) for each distribution. (B) Transmission ratio of eukaryotic virus contigs in mother–infant pairs. Error bars indicate the standard deviation. (C) Viral composition of vaginally delivered neonates (left panel) and transmission patterns from the vagina in each vaginally delivered mother–infant pair (right panel). The two most prevalent viruses are shown as examples. The size of bubbles represents the relative abundance of viruses. (D) Transmission events of other viruses in vaginally delivered mother–infant pairs.
