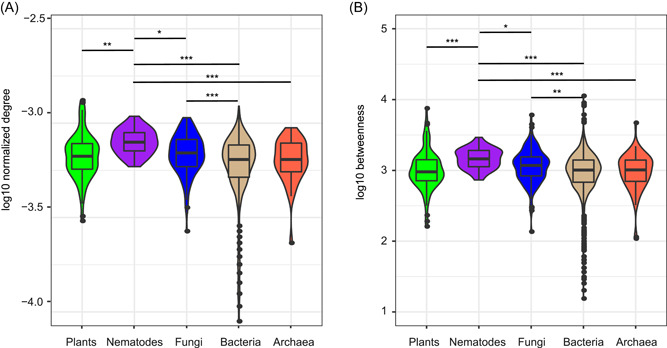
Figure 3.

Node connectedness and centrality of plants, nematodes, fungi, bacteria, and archaea in the multi‐kingdom network. (A) Node connectedness is represented by log10 normalized degree, and (B) centrality is represented by log10 betweenness. The results of post‐hoc Kruskal–Wallis test are shown in diagrams. *<0.05, **<0.01, and ***<0.001.
