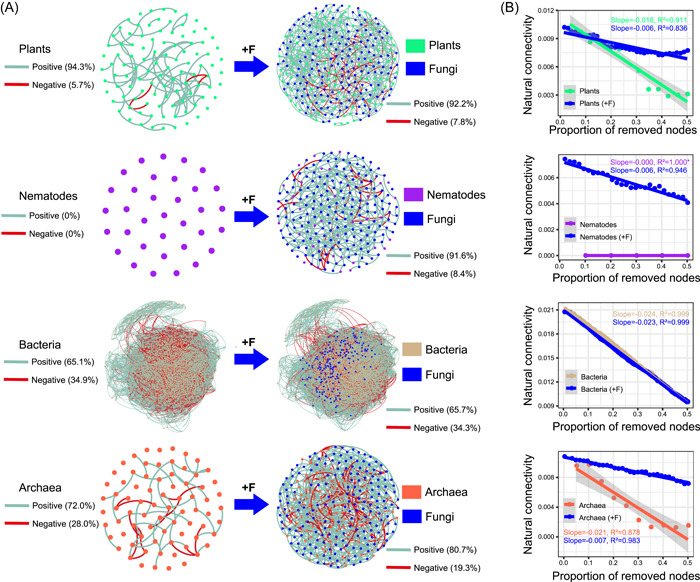
Figure 4.

The additive impacts of fungal interactions on single‐kingdom networks of plants, nematodes, bacteria, and archaea. (A) Changes in network topology with fungal interaction addition. (B) Changes in network stability with fungal interactions addition. The decreasing trend of natural connectivity is fitted with 50% nodes lost, and the R 2 and slope are shown in diagrams. The lower the absolute value of the slope, the more stable the network. “+F” represents the addition of fungal interactions on the basis of single‐kingdom networks.
