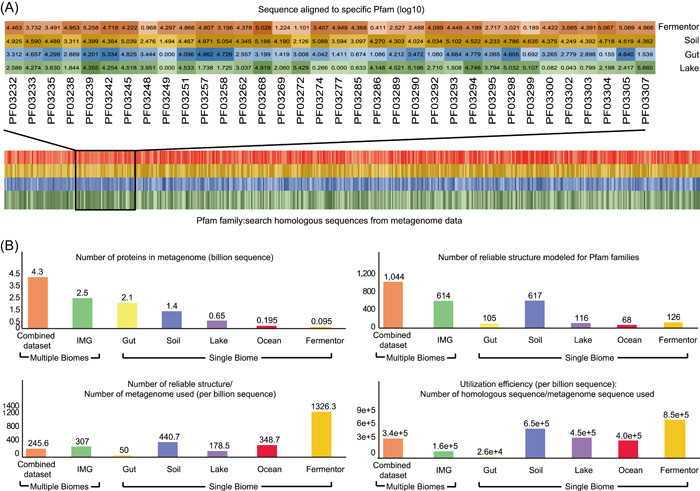
Figure 3.

Metagenome sequence utilization efficiency evaluation. (A) Supplemented by the metagenome data set from different biomes, the homologous sequences were aligned to all the Pfam families, exemplified by metagenome from four biomes. Different color means their source biome and the shade of the color represents the number of metagenome sequences aligned to the corresponding Pfam families (the darker, more sequences aligned). (B) After homologous sequences aligned, the number of Pfam families predicted with reliable structures was calculated. Averagely, after using metagenome sequences (billion sequences), the number of homologous sequences aligned, and reliable structure modeled were calculated. Then, the metagenome sequence utilization efficiency was evaluated by calculating the proportion of the number of Pfam families in the number of metagenome sequences and the proportion of the number of supplemented homologous sequences in all the metagenome sequences
