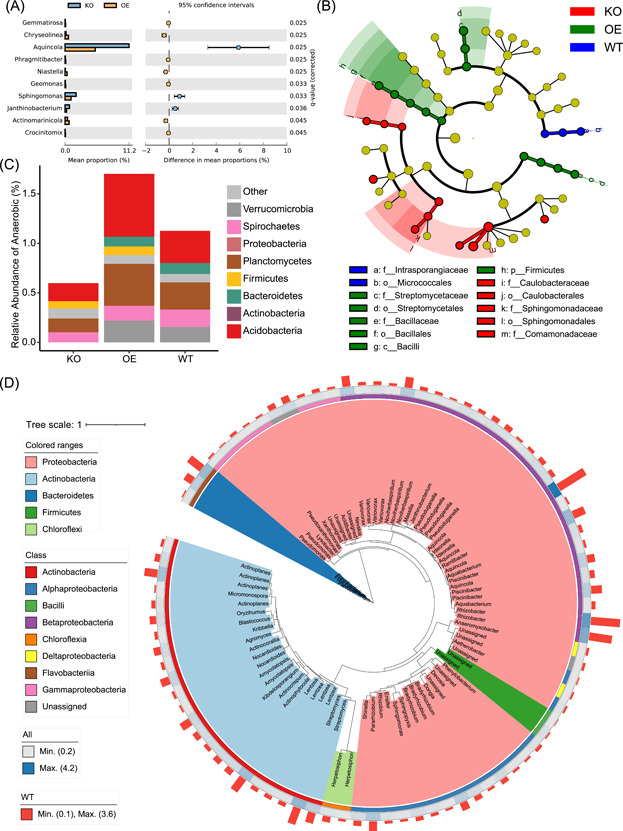
Figure 4.

Visualizations generated by third‐party software using the intermediate files of EasyAmplicon. (A) Extended error bar plot at genus level in WT and KO groups by STAMP. (B) Cladogram showing biomarkers in each group by LEfSe. (C) Percentage of BugBase annotated anaerobic bacteria at the phylum level. (D) Phylogenetic tree of 86 ASVs (relative abundance > 0.2%). The tree background is colored by Phylum. The outer strip represents different classes. The heatmap represents the average relative abundance of all samples. The bar plot represents the relative abundance of the WT group. ASVs, amplicon sequence variants; KO, knock‐out; WT, wild‐type.
