
Figure 5.
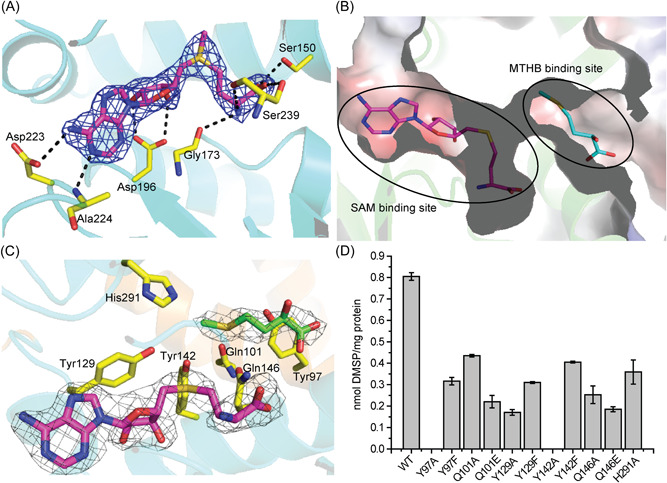
Analyses of residues of DsyB involved in binding SAM and MTHB. (A) Interactions between DsyB residues and SAM. SAM is colored in purple. The possible hydrogen bonds are represented by dashed lines. The 2F o –F c density for SAM is contoured in blue at 1.5σ. (B) Electrostatic surface of the crystal structure of DsyB. The SAM binding site and the MTHB binding site can be clearly identified. (C) The binding site of MTHB. Residues of DsyB that may participate in binding MTHB are shown in yellow. The 2F o –F c density for SAH (colored in purple) is contoured in grey at 1.5σ. The 2F o –F c density for MTHB (colored in green) is contoured in grey at 1.0σ. (D) Enzymatic activities of WT DsyB and site‐directed mutants. The error bar represents the standard deviation of triplicate experiments. WT, wild‐type.