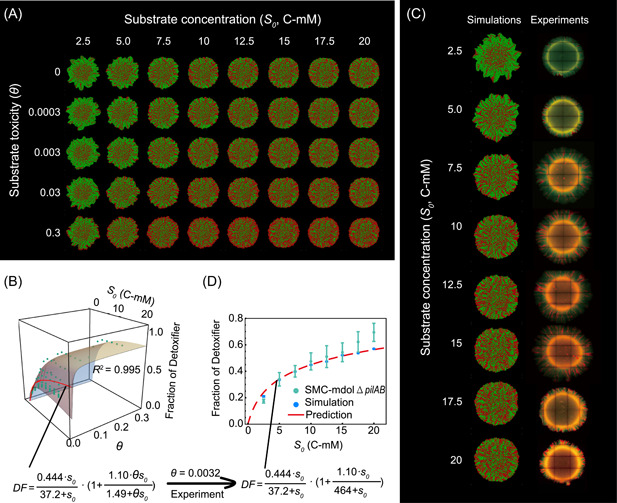
Figure 5.

Substrate concentration and toxicity governing the structure of a microbial community engaged in MDOL in a spatially structured environment. (A) Representative colony patterns from Individual‐based (IB) modeling initialized with different substrate concentrations and toxicity. Detoxifier cells are shown in red, while Embezzler cells are shown in green. (B) Analysis of community composition in the expanding region of the colonies from IB simulations across eight different initial substrate concentrations and five different toxicity strengths. The plot shows how both substrate concentration and its toxicity collectively affect the steady‐state proportion of the Detoxifier. The green dots denote the simulated steady‐state fraction of the Detoxifier. The surface shows the plot of the best‐fitting function using Equation (2). The red line on the surface denotes the scenario θ = 0.0032, which is the degree of toxicity of salicylate obtained from experimental measurements. (C) Representative colony patterns from the pattern formation assays of SMC‐mdolΔpilAB, as well as the IB simulations using the parameters matched with our synthetic system (Table S7), across eight different initial substrate concentrations. (D) The experimentally measured steady‐state fractions of Detoxifier in the expanding region of these colonies are consistent with those from mathematical predictions. Note that in the plots, substrate concentrations are shown in dimensional form (S 0 , C‐mM), but in the predictive functions, the fitting analyses were performed using its dimensionless form (s 0 ).
