
Figure 3.
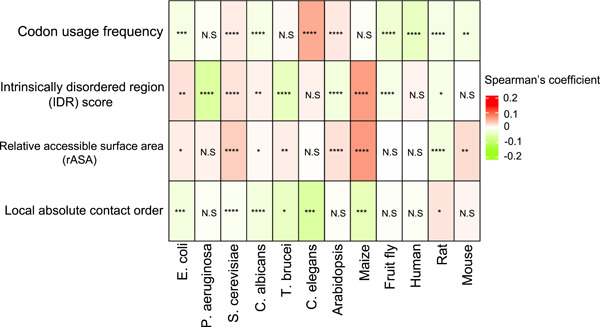
Heatmap of partial Spearman correlation coefficients between scaled footprints and protein structure features in 12 organisms. The mean of the partial correlation coefficients of all the analyzed genes is shown. Bonferroni‐corrected p‐value for multiple testing was calculated by one sample t‐test for the deviation of the mean from zero: *p < 0.05, **p < 2.2e−5, ***p < 2.2e−10, ****p < 2.2e−15. N.S, not significant. The raw values of the means and the Bonferroni‐corrected p‐values are shown in Supporting Information S2: Table S6.