
Figure 3.
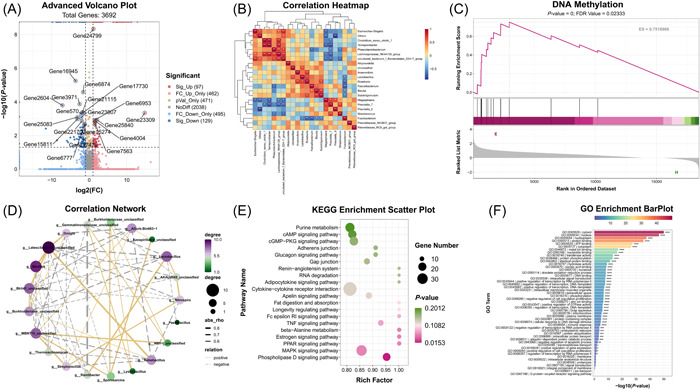
Examples of graphs: (A) volcano plot, (B) correlation heatmap, (C) GSEA Enrichment, (D) correlation network, (E) KEGG enrichment scatter plot, and (F) Classic Enrichment.
Official websites use .gov
A
.gov website belongs to an official
government organization in the United States.
Secure .gov websites use HTTPS
A lock (
) or https:// means you've safely
connected to the .gov website. Share sensitive
information only on official, secure websites.
Examples of graphs: (A) volcano plot, (B) correlation heatmap, (C) GSEA Enrichment, (D) correlation network, (E) KEGG enrichment scatter plot, and (F) Classic Enrichment.