Figure 1.

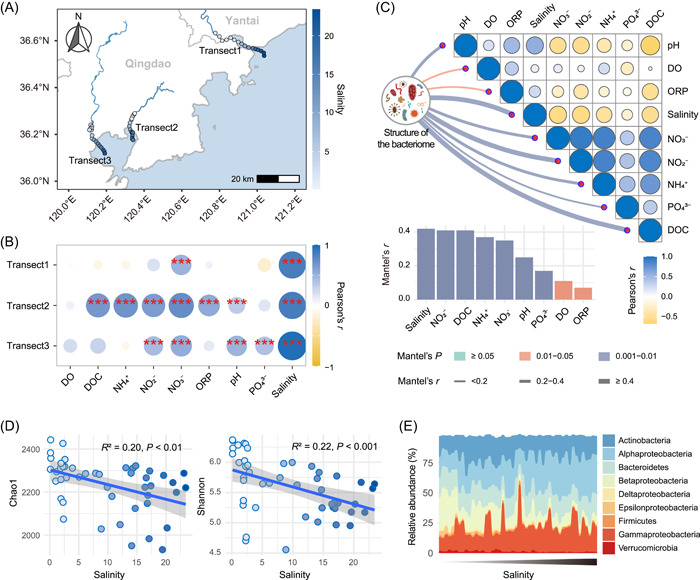
Shifts in the diversity and composition of the bacteriome from freshwater to seawater. (A) Geographical locations of sampling sites, with colors indicating salinity. (B) Responses of environmental physicochemical factors with increasing geographical distance in each transect. (C) Drivers of the bacteriome analyzed by the Mantel test. (D) Trends in the diversity of the bacteriome with salinity. (E) Fluctuations in the taxonomic composition of the bacteriome with salinity. Only the top nine taxa (members of Proteobacteria are shown at the class level and others are shown at the phylum level) in terms of relative abundance are shown in the plot, with the sum of their relative abundance accounting for more than 97.7% of the entire community.
