
Figure 3.
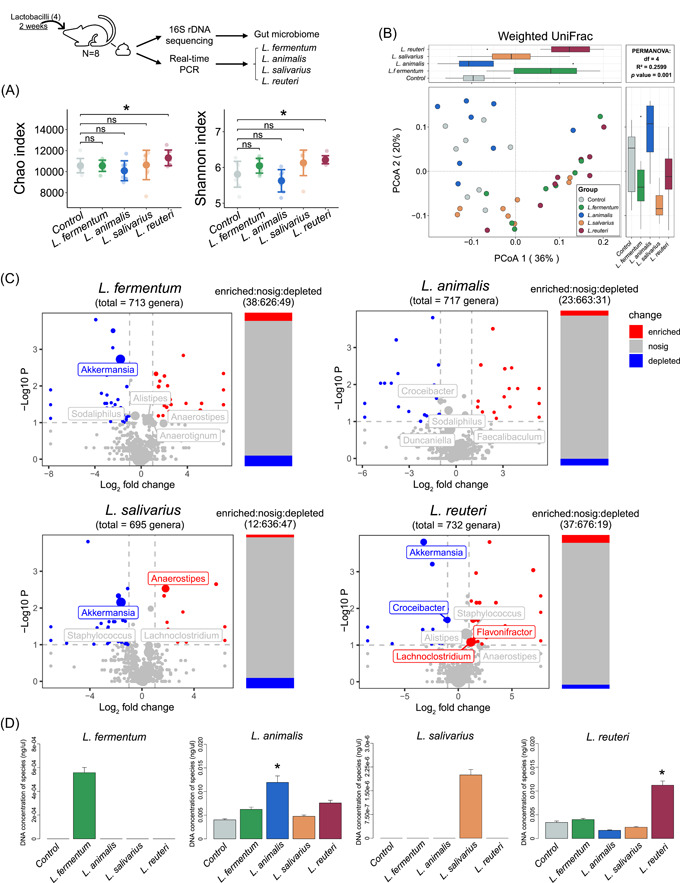
Treatment with lactobacilli alters the structure of the fecal microbiome in mice. (A) Alpha diversity (Chao richness and Shannon diversity index) of the fecal microbiome. (B) Two‐dimensional PCoA of the fecal microbiome based on WUniFrac. PERMANOVA was used for statistical significance of beta diversity; p < 0.05 was considered as statistically significant. (C) Volcano plots illustrate the genus enrichment analysis of the fecal microbiome. The Wilcoxon rank sum test was used for analysis. The labels represent the top 15 genera, and the sizes of labels and points were proportional to the average abundance of genera in each group. (D) Concentrations of four lactobacilli species (including Limosilactobacillus fermentum, Ligilactobacillus animalis, Ligilactobacillus salivarius, and Limosilactobacillus reuteri) in the fecal microbiota of mice in different groups. PCoA, principal coordinates analysis. *p < 0.05, **p < 0.01, and ***p < 0.001.