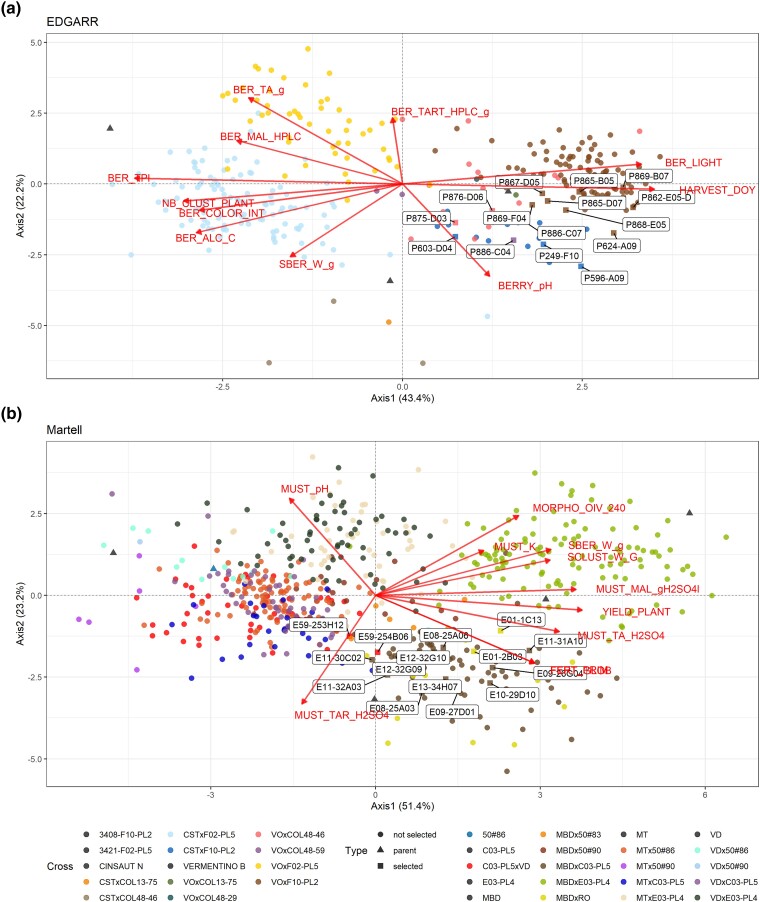
Fig. 4.
PCA of the genotypic values for the selection candidates for the traits in the selection index for the first 2 principal components. Variables are displayed in red arrows, and genotypes are colored according to their cross. Selected individuals are labeled. a) EDGARR population and b) Martell population.

