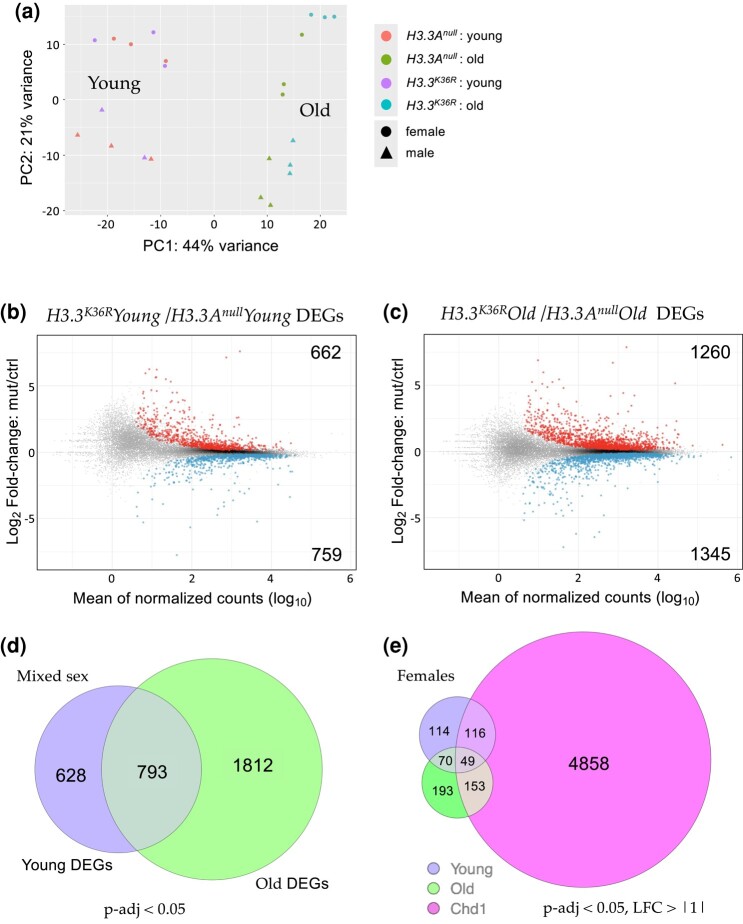
Fig. 2.
Transcriptomic profiling of young and old adult fly brains. a) PCA of young (0–2 d posteclosion) and old (21–25 d) H3.3Anull and H3.3K36R fly heads, labeled by sex. b) M/A plot comparing gene expression from mixed sex H3.3K36R and H3.3Anull young fly heads. Differentially shaded dots represent DEGs that were significantly (adjusted P-value, P-adj < 0.05) up- (red, above midline) or downregulated (blue, below). The number of DEGs in each direction is shown in the upper and lower corners. c) M/A plot of mixed sex H3.3K36R vs H3.3Anull transcripts from old adults. Labeling and significance as per panel (b). d) Venn diagram comparing overall number of DEGs (P-adj <0.05) between H3.3Anull and H3.3K36R genotypes, young and old mixed sex fly heads. e) Venn diagram of DEGs (P-adj < 0.05 and log2-fold change ≥ |1|) from female H3.3K36R (young or old) vs aged (20 d) female Chd1 fly heads. Data for Chd1 provided by Schoberleitner et al. (2021).

