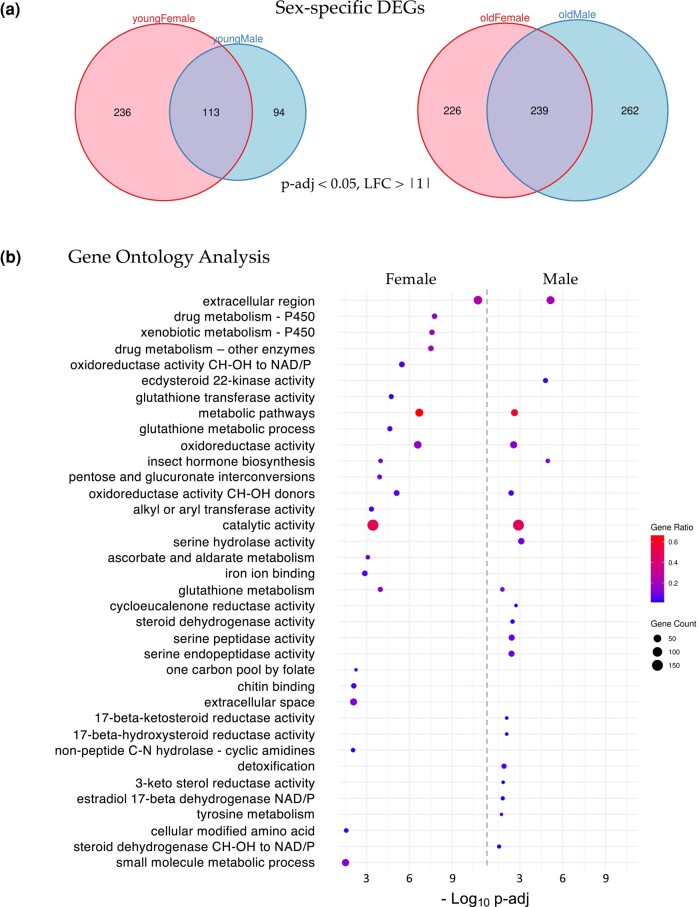
Fig. 3.
Sex-specific analysis of significant DEGs. a) Venn diagrams of age- and sex-specific DEGs (P-adj < 0.05 and, LFC > |1|) between H3.3K36R vs H3.3Anull fly heads. Left diagram compares DEGs in young female with young male fly heads (0–2 d posteclosion), and right diagram compares DEGs in old female with old male fly heads (21–25 d). b) GO analysis of the DEGs identified in panel (a) (old female and old male). The size of each dot is proportional to the number of genes contained within a given ontology term (gene count), and the fraction of those genes scoring significantly (gene ratio) is represented using a heatmap. Adjusted P-values (−log10 transformed) for each GO term were calculated and plotted separately for both females and males.

