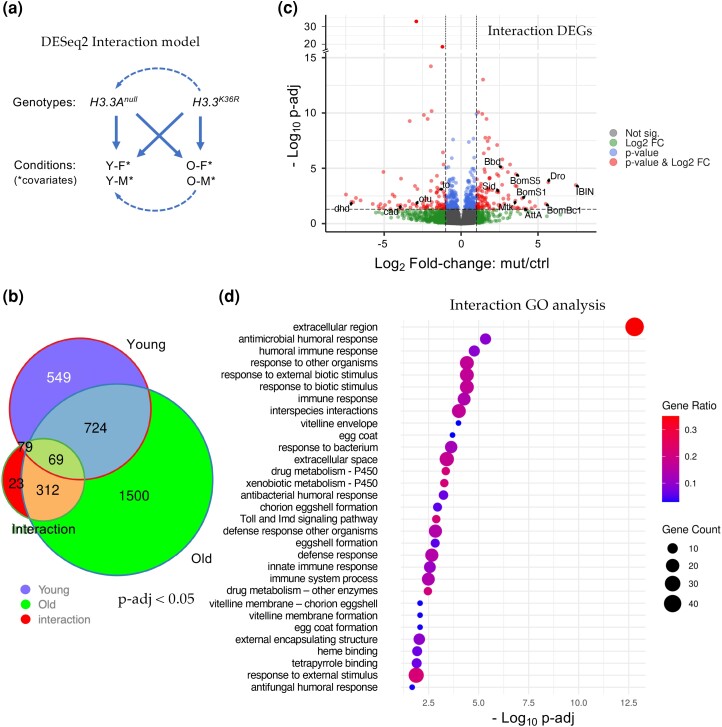
Fig. 4.
Analysis of the interaction between age and genotype in old and young fly heads. a) Graphical representation of the DESeq2 model including interaction terms (design = sex + age + genotype + age:genotype). Solid arrows represent genotype:condition terms, dotted arrows illustrate how the model sets reference levels. b) Venn diagram of DEGs (P-adj < 0.05) in young H3.3K36R vs H3.3Anull (0–2 d posteclosion) and old H3.3K36R vs H3.3Anull fly heads (21–25 d), compared to those identified using the interaction model (age:genotype). c) Volcano plot of RNA-Seq data obtained using the interaction model. Dotted lines represent significance cutoffs for adjusted P-value and log2-fold change. Dots represent individual genes, color coded according to the key at right. d) GO analysis of DEGs (P-adj < 0.05 and LFC > |1|) that were determined using the interaction model. Adjusted P-values (−log10 transformed) for each GO term were calculated and plotted. The size of each dot is proportional to the number of genes contained within a given ontology term (gene count), and the fraction of those genes scoring significantly (gene ratio) is represented using a heatmap.

