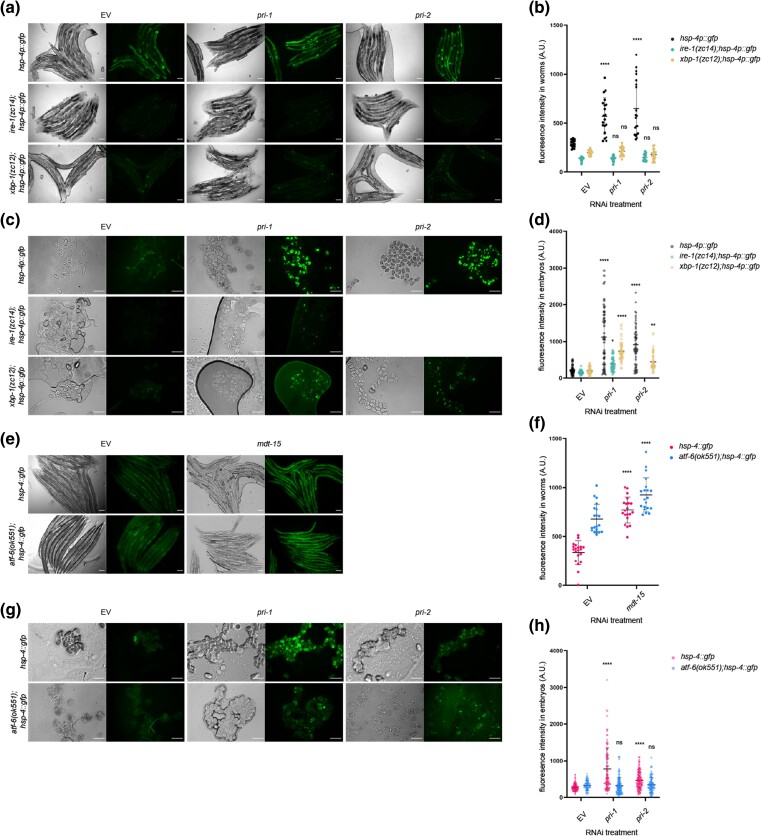
Fig. 2.
Activation of hsp-4 by pri-1 or pri-2 RNAi requires ire-1, xbp-1, and atf-6. a and b) The figure shows representative micrographs (a) and whole-worm GFP quantification (b) of hsp-4p::gfp, ire-1(zc14);hsp-4p::gfp, and xbp-1(zc12);hsp-4p::gfp adult worms fed EV, pri-1, or pri-2 RNAi (n = 3 experiments totaling >20 individual animals per RNAi treatment). c and d) The figure shows representative micrographs (c) and GFP quantification (d) of embryos laid by hsp-4p::gfp, ire-1(zc14);hsp-4p::gfp, and xbp-1(zc12);hsp-4p::gfp adult worms fed EV, pri-1, or pri-2 RNAi (n = 3 experiments totaling >50 individual embryos per RNAi treatment; note that pri-2 caused lethality in this experiment, preventing experimental assessment). e and f) The figure shows representative micrographs (e) and whole-worm GFP quantification (f) of hsp-4::gfp and atf-6 (ok551);hsp-4::gfp adult worms fed EV or mdt-15 RNAi (n = 3 experiments totaling >20 individual animals per RNAi treatment). g and h) The figure shows representative micrographs (g) and GFP quantification (h) of embryos laid by hsp-4::gfp and atf-6(ok551);hsp-4::gfp adult worms fed EV, pri-1, or pri-2 RNAi (n = 3 experiments totaling >75 individual embryos per treatment). In all micrographs, the scale bar represents 100 μm. In dot plots, each dot represents the signal detected in one individual worm or embryo; the error bars represent standard deviation. Statistical analysis: b, d: ns P > 0.05, *P < 0.05, **P < 0.01, ****P < 0.0001, vs. EV RNAi-treated control of the same genotype (2-way ANOVA test corrected for multiple comparisons using Sidak's method).

