Fig. 5.
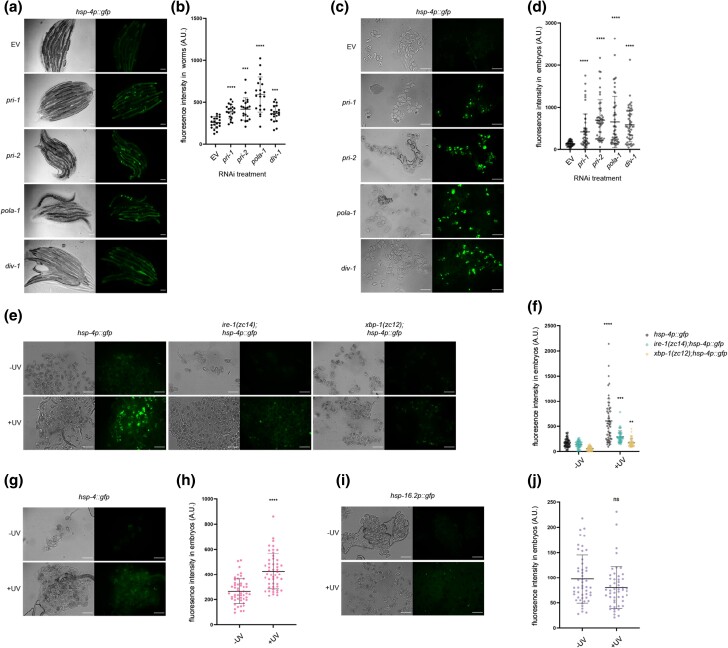
Knockdown of polymerase α primase complex subunits and UV–C irradiation cause UPR-ER activation. a and b) The figure shows representative micrographs (a) and whole-worm GFP quantification (b) of hsp-4p::gfp adult worms fed EV, pri-1, pri-2, pola-1, or div-1 RNAi (n = 3 experiments totaling >20 individual animals per RNAi treatment). c, d) The figure shows representative micrographs (c) and GFP quantification (d) of embryos laid by hsp-4p::gfp adult worms fed EV, pri-1, pri-2, pola-1, or div-1 RNAi (n = 3 experiments totaling >50 individual embryos per RNAi treatment). e and f) The figure shows representative micrographs (e) and GFP quantification (f) of embryos laid by hsp-4p::gfp, ire-1(zc14);hsp-4p::gfp, and xbp-1(zc12);hsp-4p::gfp adult worms irradiated with 400 J/m2 UV–C (n = 3 experiments repeats, totaling >50 individual embryos for each sample). g and h) The figure shows representative micrographs (g) and GFP quantification (h) of embryos laid by hsp-4::gfp adult worms irradiated with 400 J/m2 UV–C (n = 3 experiments totaling >50 individual embryos for UV-irradiated and nonirradiated samples). i and j) The figure shows representative micrographs (i) and GFP quantification (j) of embryos laid by hsp-16.2p::gfp adult worms irradiated with 400 J/m2 UV–C (n = 3 experiments totaling >50 individual embryos for UV-irradiated and nonirradiated samples). In all micrographs, the scale bar represents 100 μm. In dot plots, each dot represents the signal detected in one individual worm or embryo; the error bars represent standard deviation. Statistical analysis: b, d: ***P < 0.001, ****P < 0.0001 vs. EV RNAi control (Brown–Forsythe and Welch ANOVA test corrected for multiple comparisons using the Dunnett T3 method); f: **P < 0.01, ***P < 0.001, ****P < 0.0001 vs. nonirradiated embryos of the same genotype (ordinary 2-way ANOVA test corrected for multiple comparisons using Sidak's method); h, j: ns P > 0.05, ***P < 0.001, ****P < 0.0001 vs. nonirradiated embryos (Welch's t-test).

