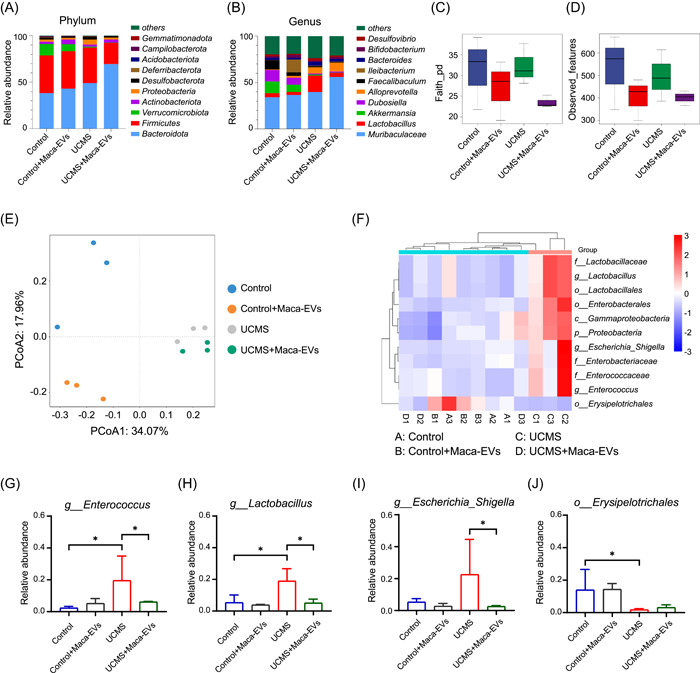
Figure 3.

Effects of Maca‐EVs on the microbiota composition in Control and UCMS mice feces. Mice were killed when the behavior tests were accomplished, and feces were collected for 16S rRNA sequencing analysis. Control, Control + Maca‐EVs, UCMS, and UCMS + Maca‐EVs groups were included in the present study (n = 3 experiments for each group). Relative abundance of microbiota (top 10) at phylum (A) and genus (B) levels in the different groups. Alpha diversity regarding the index of Faith's phylogenetic diversity metric (pd) (C) and observed features (D) in the different groups. (E) Principal coordinate analysis (PCoA) based on the Bray‐curtis distance matrixes between sample groups. (F) Linear discriminant analysis effect size (LEfSe) was performed to compare microbial composition at 16S rDNA operational taxonomic unit (OTU) level between sample groups. A total of 11 OTUs that significantly differed between New_Control and UCMS groups (p < 0.05; linear discriminant analysis [LDA] > 4.0) were shown. (G–J) The abundance changes of typical bacteria that were significantly differed between New_Control and UCMS among sample groups. EV, extracellular vesicle; rDNA, recombinant DNA; rRNA, ribosomal RNA; UCMS, unpredictable chronic mild stress.
