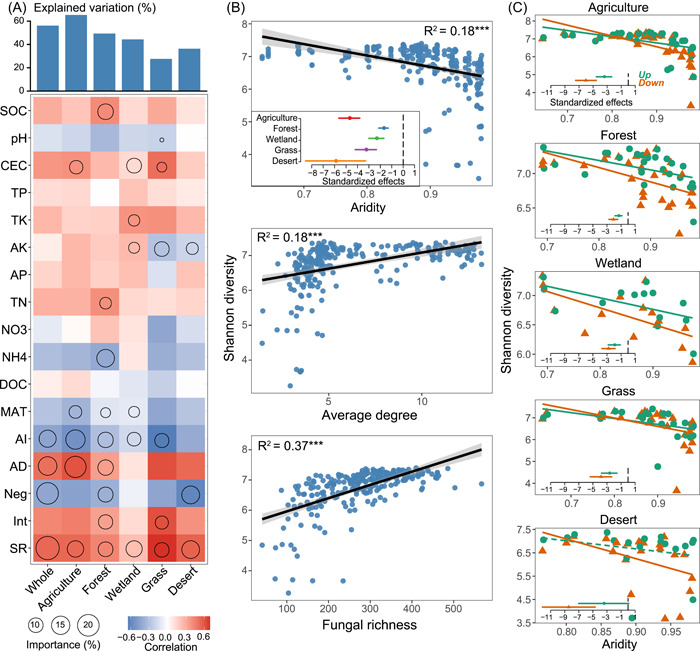
Figure 2.

Drivers of soil bacterial α‐diversity across different biomes. (A) Contributions of abiotic and biotic factors to bacterial α‐diversity based on correlation and random forest model. Circle size represents the variables' importance (i.e., percentage of increase of mean square error calculated via random forest model). Colors represent Spearman's correlations. The abbreviations of edaphic and climatic properties accorded to the Method. AD, average degree; Neg, the proportion of negative associations; Int, the proportion of interacted associations between bacterial and fungal taxa; SR, soil fungal richness. (B) Relationships between bacterial α‐diversity and the main drivers were estimated via linear least‐squares regression analysis. Standardized effects (standardized slopes [mean ± SEM]) of aridity on bacterial α‐diversity were compared among different biomes. (C) Relationships between aridity and the bacterial α‐diversity in surface (0−15 cm) and subsurface (15–30 cm) layers, estimated via linear least‐squares regression analysis. Standardized effects of aridity on bacterial α‐diversity were compared between these two layers
