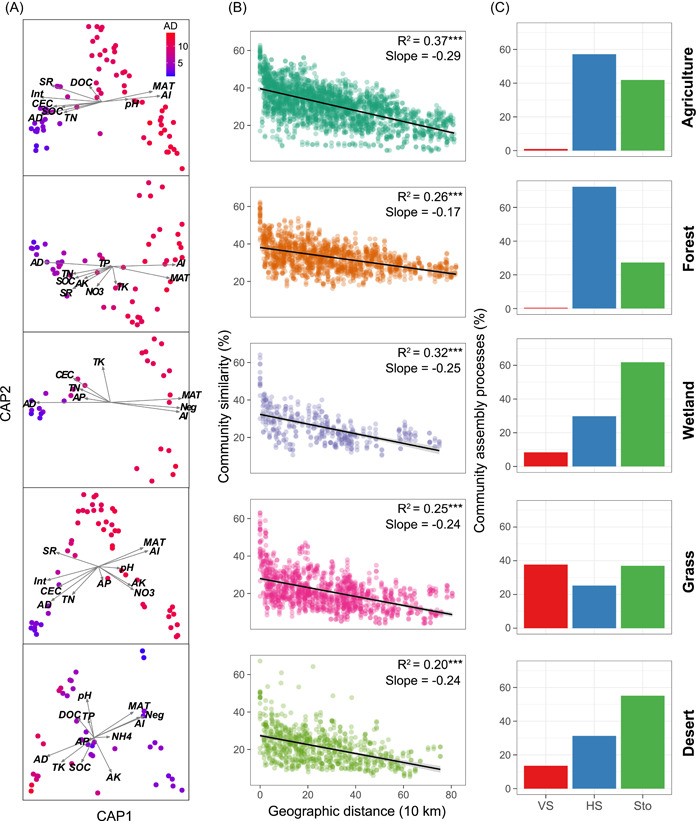
Figure 3.

Biogeographic patterns of bacterial β‐diversity across different biomes. (A) Constrained analysis of principal coordinates (CAP) showing abiotic and biotic factors that influenced bacterial assembly. Sample points are colored according to the average degree (AD). (B) Distance–decay curves showing Bray–Curtis similarity against geographic distances between sampling sites. Solid lines denote the ordinary least squares linear regressions. Asterisks denote significant correlation (***p < 0.001). (C) The fraction of turnover in the assembly of soil bacterial communities, as governed primarily by deterministic (homogeneous [HS] and variable selection [VS]) and stochastic processes (Sto)
