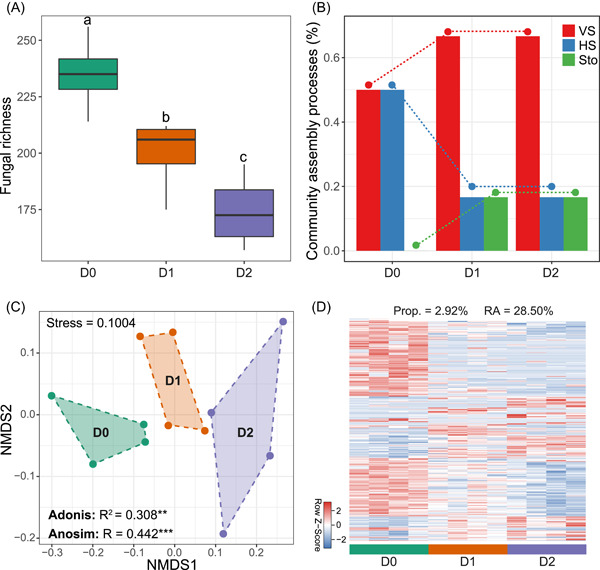
Figure 6.

Linkages between soil fungal richness and bacterial community assembly in a microcosm study. (A) Difference in soil fungal richness among treatments with different fungicide concentrations (D0, no addition; D1, 6 mg kg−1; D2, 14 mg kg−1). Data that do not share a letter are significantly different between treatments (p < 0.05; multiple comparisons with Kruskal–Wallis tests). (B) Variations in assembly processes of bacterial communities among treatments, estimated via deterministic (homogeneous [HS] and variable selection [VS]) and stochastic processes (Sto). (C) Nonmetric multidimensional scaling (NMDS) ordination plot showing the bacterial β‐diversity among treatments. The significances were examined using the Adonis and Anosim tests (**p < 0.01; ***p < 0.001). (D) Heatmap of the bacterial taxa showing significant differences in relative abundance among treatments. Each row in the heatmap has been standardized (to a mean of zero and a standard deviation of one) with its color intensity proportional to the standardized relative abundance of the taxa. Prop., the proportions of the differentiated taxa; RA, the total abundance of the differentiated taxa
