
Figure 3.
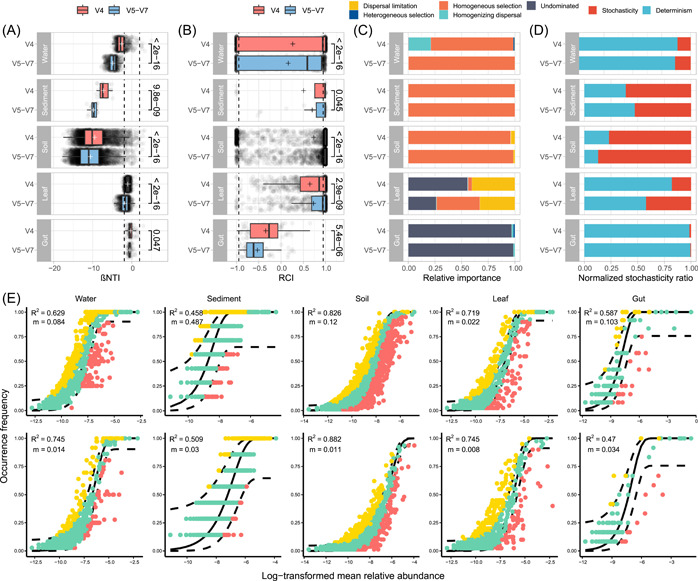
Primer bias in evaluating the community assembly process. STEN analysis based on βNTI (A) and RCI (B) for all pairwise community comparisons in each habitat in two primer data sets. Dashed lines at βNTI = −1.96 (homogeneous selection) and βNTI = 1.96 (variable selection) denote significance thresholds of phylogenetic signals. Dashed lines at RCI = −0.95 (homogenizing dispersal) and RCI = 0.95 (dispersal limitation) denote significance thresholds of taxonomic signals. Boxplots show the median (line), mean (plus sign), 25th and 75th percentiles (box), and 1.5× the interquartile range (whiskers). (C) Assembly process quantification: homogeneous selection (βNTI < −1.96; determinism), heterogeneous selection (βNTI > 1.96; determinism), homogeneous dispersal (|βNTI| < 1.96 and RCI > 0.95; stochasticity), dispersal limitation (|βNTI| < 1.96 and RCI < −0.95; stochasticity), and undominated processes (|βNTI| < 1.96 and |RCI| < 0.95, for example, weak selection, weak dispersal, diversification, and drift; stochasticity). (D) NST analysis quantifying taxonomic normalized stochasticity ratio in each habitat in two primer data sets. (E) SLON fitness indicated by R 2 values (fit to neutral assembly process) and m values (estimated migration rate) in each habitat in two primer data sets. Each point represents an amplicon sequence variant (ASV) colored based on the comparison of the actual taxon distribution (solid line) and 95% confidence interval (dashed lines) of model prediction, whether the ASV is above (yellow), below (red), or neutral (dark green). NST, Ning's normalized stochastic ratio model; RCI, Raup–Crick Index; SLON, Sloan's neutral model; STEN, Stegen's null model; βNTI, β‐nearest‐taxon index.