
Figure 3.
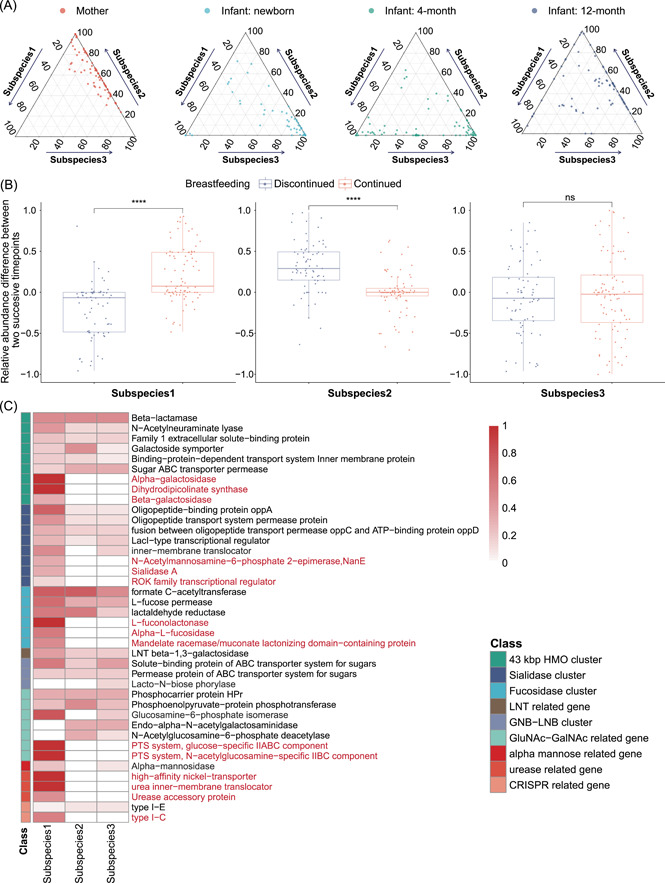
Succession of Bifidobacterium longum subspecies in infant gut microbiome can be attributed to the selection of nutrient utilization. (A) Ternary plots of the predicted composition of three subspecies of B. longum from mothers and infants of multiple time points (newborns, 4 months, and 12 months). Each dot represents one sample. (B) The shift in the relative abundance of B. longum subspecies between successive time points. According to the breastfeeding status at the subsequent time point, infants are divided into two groups (purple, discontinued breastfeeding, N = 86; red, continued breastfeeding, N = 71). ****p < 0.00005; ns, not significant; Student's t test. (C) Gene family profiles of predicted B. longum subspecies. Gene families related to the metabolism of host glycans, urease, and CRISPR (KEGG annotations) are selected for display. The color bar on the left indicates the class of gene clusters. Each row is a subclass of gene families and unique gene families of subspecies 1 are marked in red. The color scale in the heatmap indicates the normalized gene family coverage in the specific subclass (i.e., the fraction of detected gene families belonging to the subclass). HMO, human milk oligosaccharide; KEGG, Kyoto Encyclopedia of Genes and Genomes; ABC, ATP‐binding cassette transporters; ATP, adenosine triphosphate; CRISPR, clustered regularly interspaced short palindromic repeat; Gal, galactose; Gal‐NAc, N‐acetylgalactosamine; Glu‐NAc, N‐acetylglucosamine; GNB, galacto‐N‐biose; LNB, lacto‐N‐biose; LNT, lacto‐N‐tetraose; PTS, phophotransferase system; ROK, repressor, open reading frame, kinase.