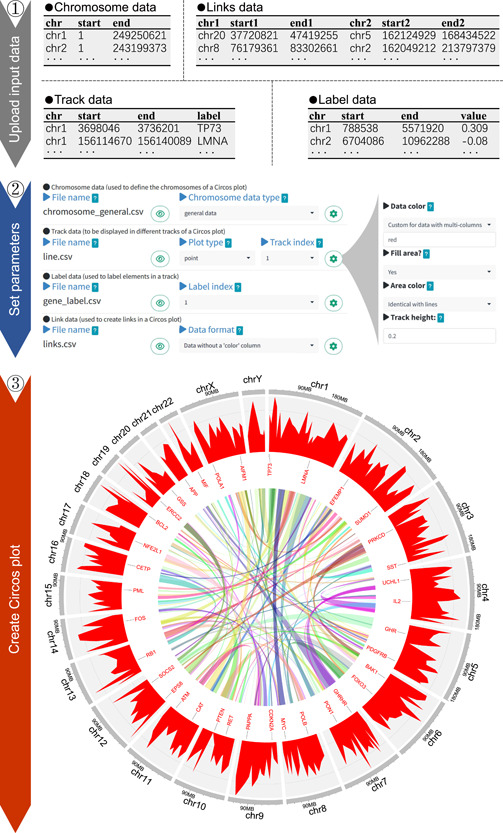
Figure 3.

Illustration of the basic steps for creating a Circos plot with shinyCircos‐V2.0. The top panel displays the first two rows and column titles of the four input data sets. The middle panel showcases the widgets used to set parameters for each input data set. For each input data set, additional widgets can be accessed via a pop‐up window that can be opened by clicking on the gear symbol in the same line as the input data set. The bottom panel demonstrates the Circos plot created using the four input data sets and the set parameters.
