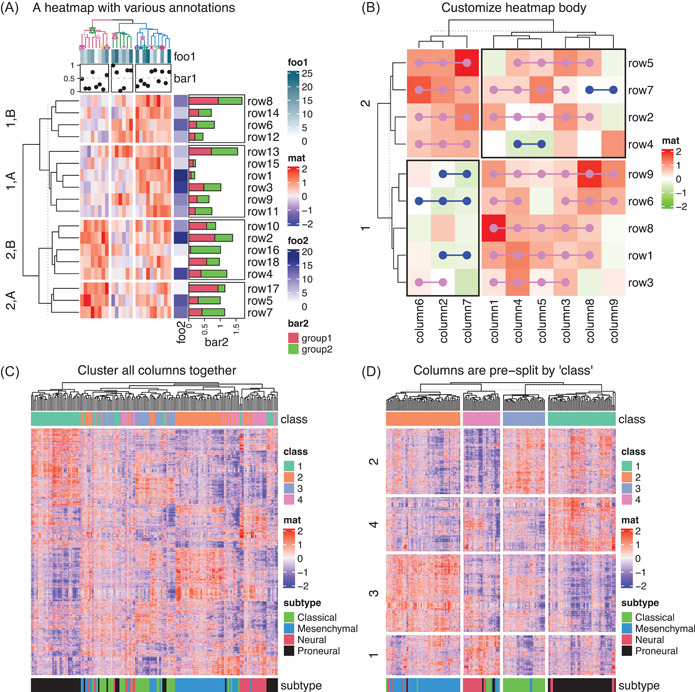
Figure 2.

Demonstration of single heatmaps. (A) Heatmap with both row and column annotations. The columns on the heatmap are split by a three‐group k‐means clustering and rows are split by combinations of a categorical variable and a two‐group k‐means clustering. (B) Heatmap with customizations on the heatmap body. Data in Figure (A) and (B) are randomly generated. (C) Heatmap without and (D) with column splitting. The matrix for Figure (C) and (D) is the same.
