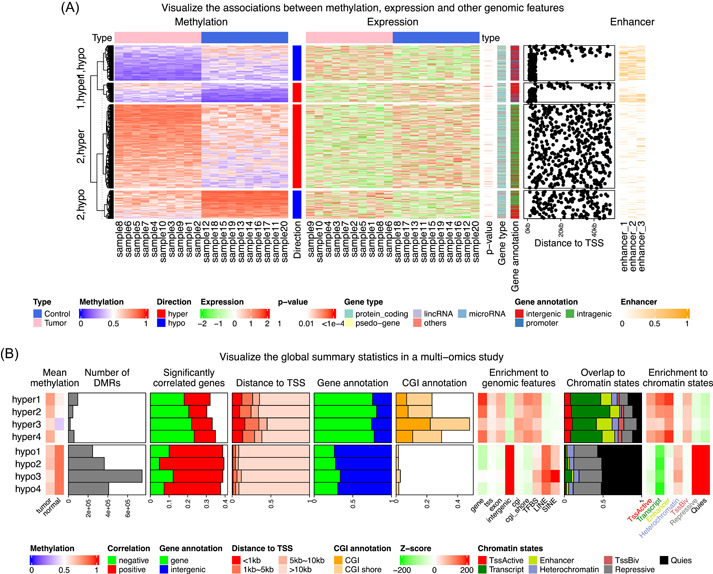
Figure 4.

Demonstration of complex heatmap list visualization. (A) Visualization of the association between DNA methylation, gene expression, and related genomic features. For simplicity of the figure, it only includes DMRs showing negative correlations to associated genes. (B) Comprehensive visualization of the global summary statistics of an epigenomics study. DMRs, differentially methylated regions.
