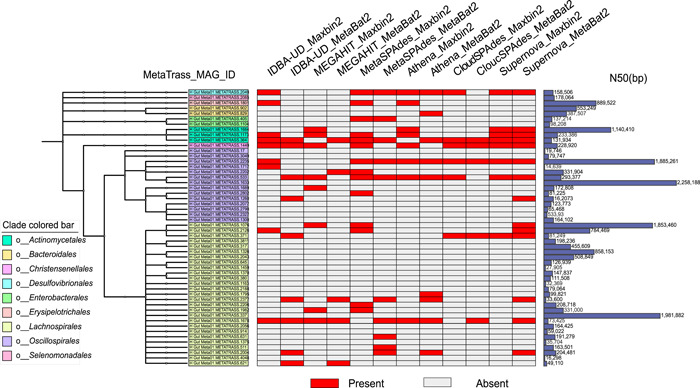
Figure 5.

Taxonomic tree of the high‐quality genomes assembled by MetaTrass for H_Gut_Meta01. The taxonomic tree is on the left. The distribution of the high‐quality genomes assembled by other methods is colored red in the middle heatmap. N50 of each high‐quality genome is shown in the right histogram.
