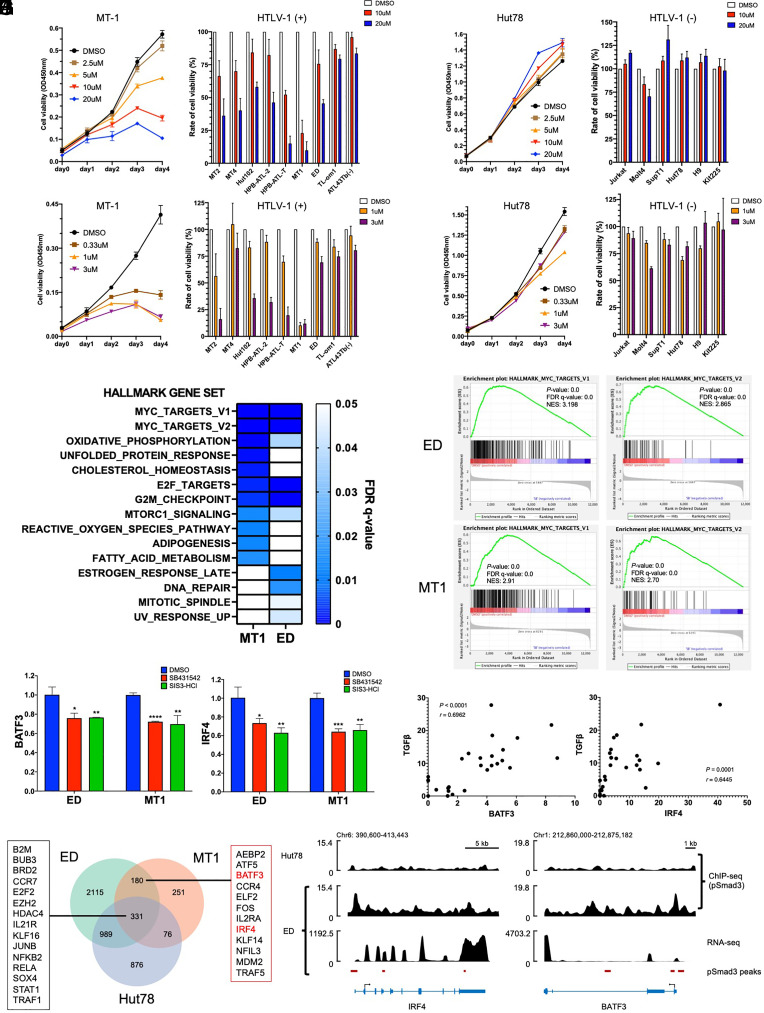
Fig. 5.
Blockage of TGF-β/Smad signaling suppresses ATL cell proliferation. (A and B) Cell growth of MT-1 (A) Hut78 (B) cells treated with SB431542 (Left), and cell growth rates of assorted HTLV-1-infected T cell lines (n = 9) (A) and HTVL-1 noninfected T cell lines (n = 6) (B) treated with SB431542 at day 4 are shown (Right) (normalized mean ± SD of triplicate experiments). (C and D) Cell growth of MT-1 (C) Hut78 (D) cells treated with SIS3-HCl cell (Left), and cell growth rates of assorted HTLV-1-infected T cell lines (n = 9) (C) and HTVL-1 noninfected T cell lines (n = 6) (D) treated with SIS3-HCl at day 4 are shown (Right) (normalized mean ± SD of triplicate experiments). (E) Hallmark gene sets down-regulated in MT-1 and ED cells upon treatment with SB431542, analyzed by RNA-seq. (F) Significantly enriched gene signatures for Myc-related gene sets in SB431542 treated ED cells and MT-1 cells, determined by GSEA analysis with RNA-seq. (G) BATF3 and IRF4 expression in ED and MT-1 cells treated with SB431542 or SIS3-HCl, analyzed by RT-qPCR (one-way ANOVA with Tukey correction; *P < 0.05; **P < 0.01; ***P < 0.001; ****P < 0.0001). (H) Correlation of TGF-β protein with BATF3 protein or IRF4 protein in fresh ATL cells (n = 26), detected by multiplex mass-cytometry analysis (CyToF) (Pearson correlation analysis). (I) Venn diagram of differently expressed genes (DEG) by ChIP-seq in ED cells, MT-1 cells, and Hut78 cells. (J) Enrichment of phosphorylated Smad3 in BATF3 and IRF4 genes demonstrated by ChIP-seq analysis in an ATL cell line (ED) and a non-ATL T cell line (Hut78).

