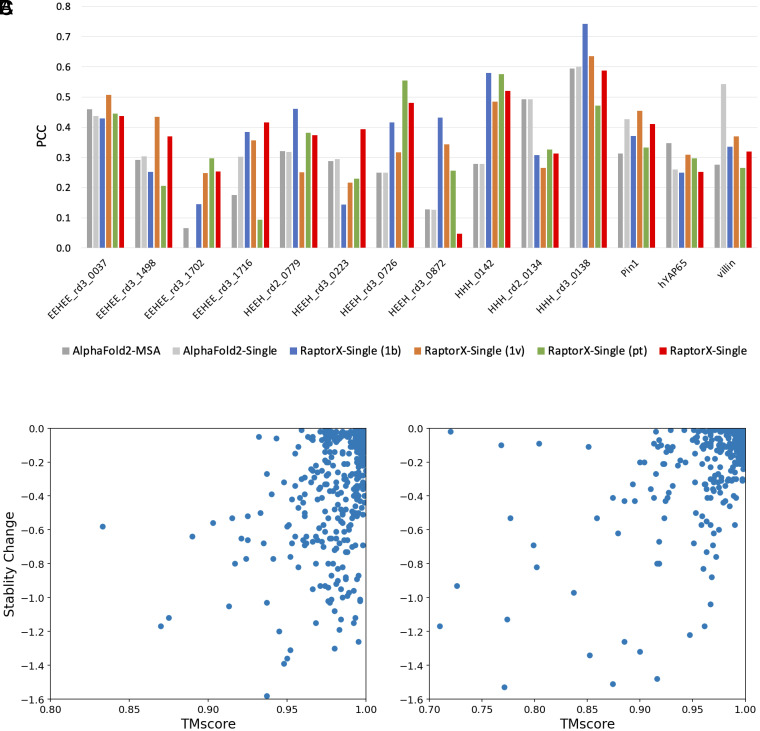
Fig. 2.
Performance comparison of predicted structure change and stability change of single mutations. (A) The PCC between predicted structure change and stability change of all targets. (B) The scatter plot of predicted structure change by RaptorX-Single and stability change for target HHH_0142. (C) The scatter plot of predicted structure change by RaptorX-Single and stability change for target HHH_rd3_0138.

