
Fig. 4.
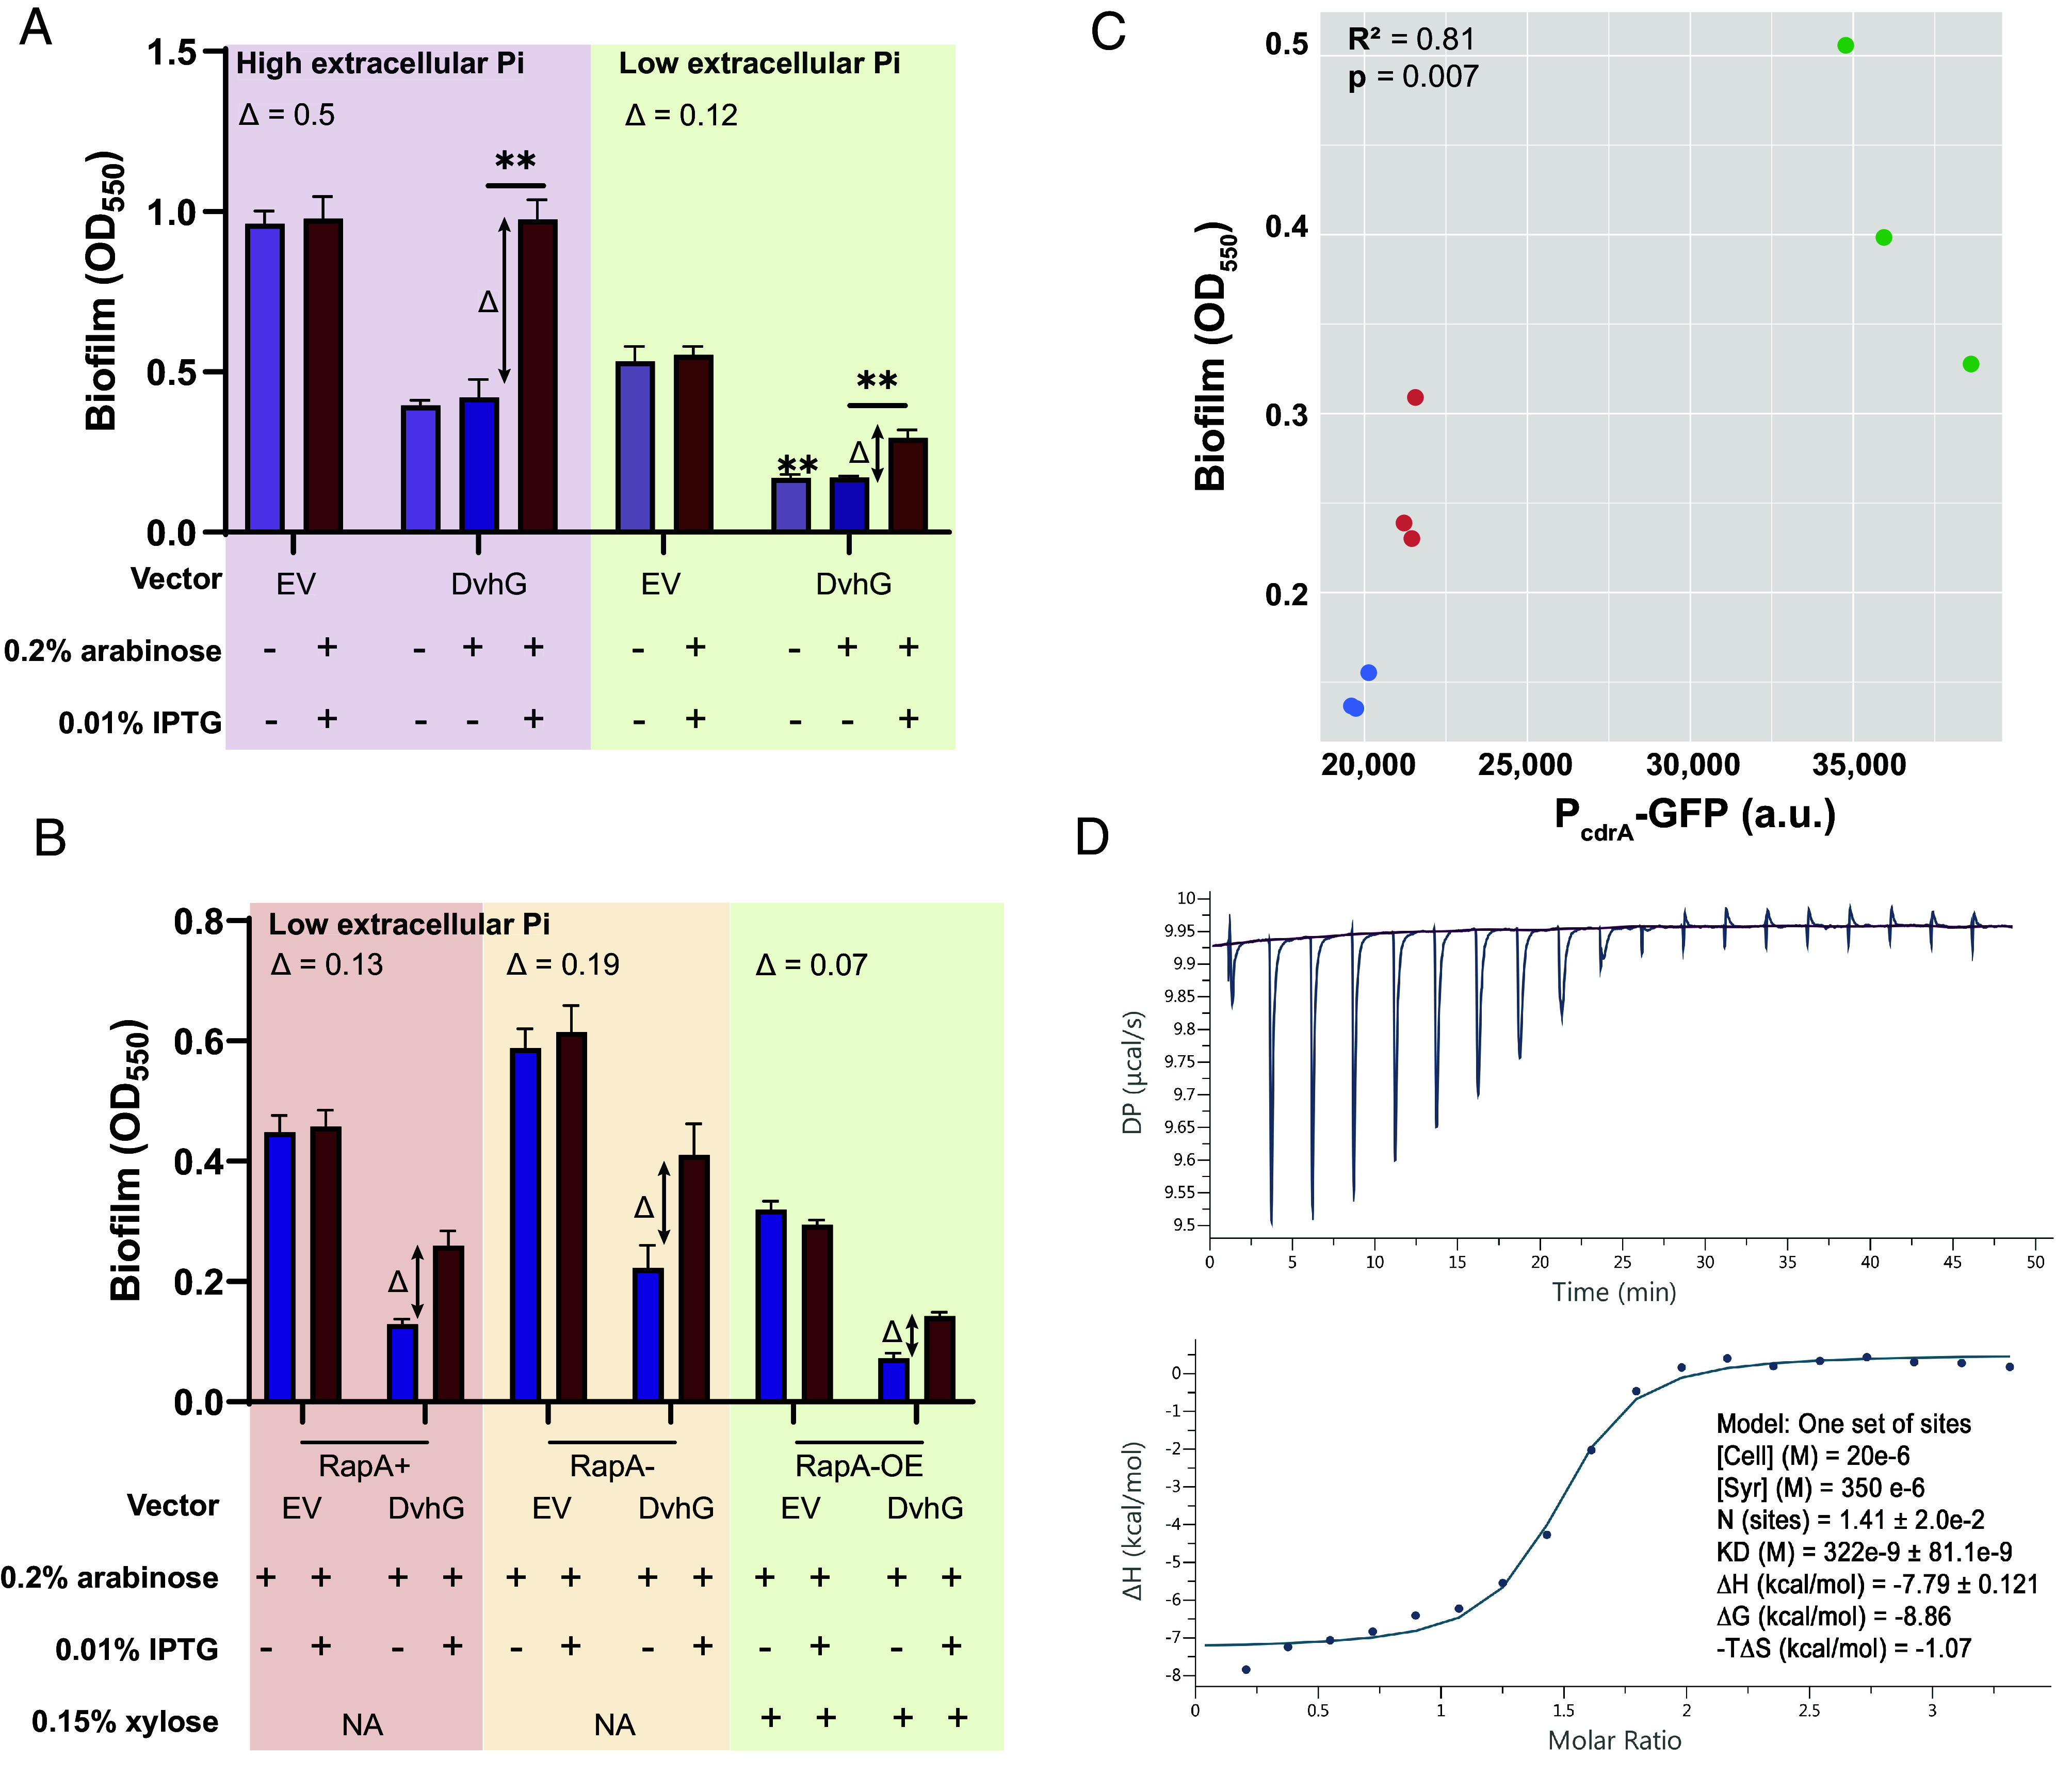
Biofilm rescue by DvhD is c-di-GMP dependent. (A) Biofilm formed in the Pf0-1 attTn7::lacIPtacdvhD-HA ΔlapGΔlapDdvhA-hlx-swap strain in low phosphate K10Tπ medium (~0.1 mM) or high phosphate K10T medium (1 mM) at 24 h. The strain contains either no vector, an empty vector or a plasmid expressing full-length DvhG. Arabinose at 0.2% concentration and IPTG at 0.01% concentration are used to induce dvhG expression from the plasmid and dvhD expression from the genome, respectively. “Δ” quantifies the extent of biofilm rescue by DvhD and is represented by the difference in biofilm formation by the strain expressing DvhG but not DvhD (purple bar) and biofilm formation by the strain expressing both DvhG and DvhD (red bar). (B) Biofilm formed by the Pf0-1 attTn7::lacIPtacdvhD-HAΔlapGΔlapDdvhA-hlx-swap strain in low phosphate K10Tπ medium at 24 h with, WT RapA phosphodiesterase (RapA+), without RapA− (ΔrapA) or with RapA overexpressed by xylose-inducible PxutR promoter (RapA-OE) in the background. The extent of biofilm rescue by DvhD, “Δ”, is compared among the three strains and indicated over the bar plots. Statistical analysis was performed using one-way ANOVA corrected for multiple comparisons (ns, P > 0.05; *P ≤ 0.05; **P ≤ 0.01; ***P ≤ 0.001; ****P ≤ 0.0001). (C) Graph representing intracellular c-di-GMP levels calculated from GFP fluorescence from a PcdrA-gfp promoter transcriptional fusion plotted versus biofilm formed when DvhD is induced. Linear correlation (R2) and statistical significance was calculated using Pearson’s test in R (v 4.3.0). (D) The purified cytosolic fragment of DvhD binds c-di-GMP with high affinity. Isothermal titration calorimetry was used to determine the apparent affinity (expressed as KD) of DvhD’s cytosolic fragment for c-di-GMP. The top graph shows the titration experiment, the bottom graph shows the fit of a single-binding site model to the data. Experimental parameters and calculated binding characteristics are reported in the Inset. Shown are representative plots from three independent experiments.