Fig. 3.
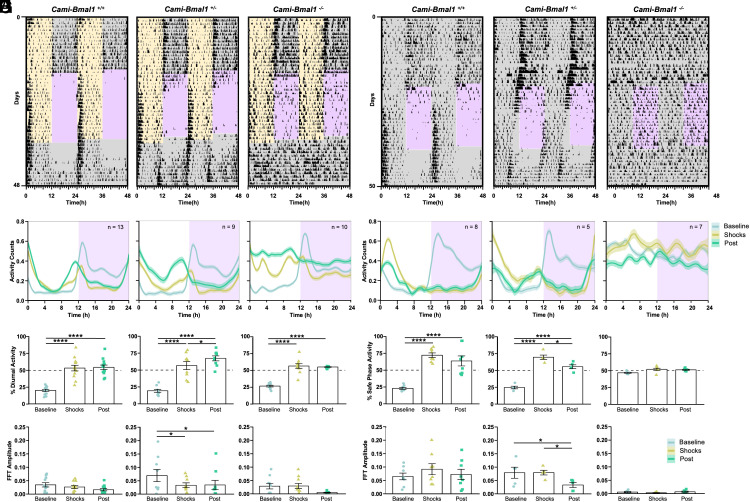
The expression of the clock gene Bmal1 in the forebrain is necessary for fear entrainment. (A) Representative foraging actograms from Cami-Bmal1+/+, Cami-Bmal1+/−, and Cami-Bmal1−/− mice subjected to DF. (B) Average activity patterns from Cami-Bmal1+/+ (Left, n = 13), Cami-Bmal1+/− (Center, n = 9), and Cami-Bmal1−/− mice (Right, n = 10) in LD subjected to DF. (C) Percentage of activity during the daytime or extrapolated daytime across the different experimental stages from the same mice shown in B. (D) Fast-Fourier transform (FFT) amplitude across the successive stages from the same mice shown in B. (E) Representative foraging actograms from Cami-Bmal1+/+, Cami-Bmal1+/−, and Cami-Bmal1−/− mice subjected to a 12-h window of noncued fear under DD. (F) Average activity patterns from Cami-Bmal1+/+ (Left, n = 8), Cami-Bmal1+/− (Center, n = 5), and Cami-Bmal1−/− mice (Right, n = 7) subjected to noncued fear in DD. (G) Percent of activity that took place during the safe phase (window of time without shocks) or extrapolated safe phase across the different experimental stages from the same mice shown in F. (H) FFT amplitude across the successive stages from the same mice shown in F. Asterisks indicate statistically significant differences according to Tukey comparisons following LMM analysis: *P < 0.05, **P < 0.01, ***P < 0.001, ****P < 0.0001.

