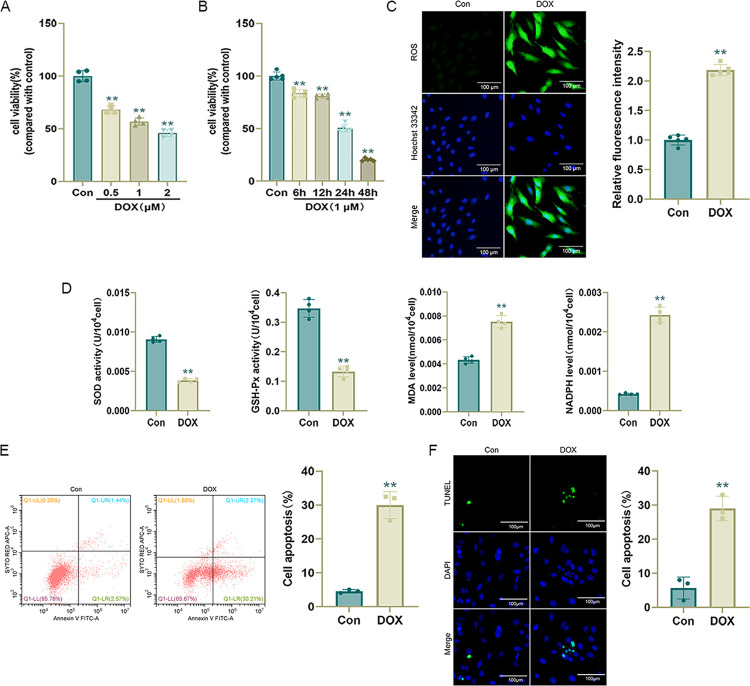
Fig 1. DOX induces H9c2 cell damage.
(A) and (B) Cell viability determined by CCK-8 assays after treatment with DOX at different concentrations for 24 h and treatment with 1 μmol/L DOX for different times (n = 4 or 5); (C) Representative DCFH-DA images and statistical results (n = 5); (D) SOD, GSH-Px, MDA, and NADPH levels in H9c2 cells (n = 4); (E) Apoptosis rate measured by flow cytometry (n = 3). (F) Representative TUNEL staining images and statistical results (n = 3). Values represent the mean±SD.*p<0.05 vs. Con group,**p<0.01 vs. Con group.

