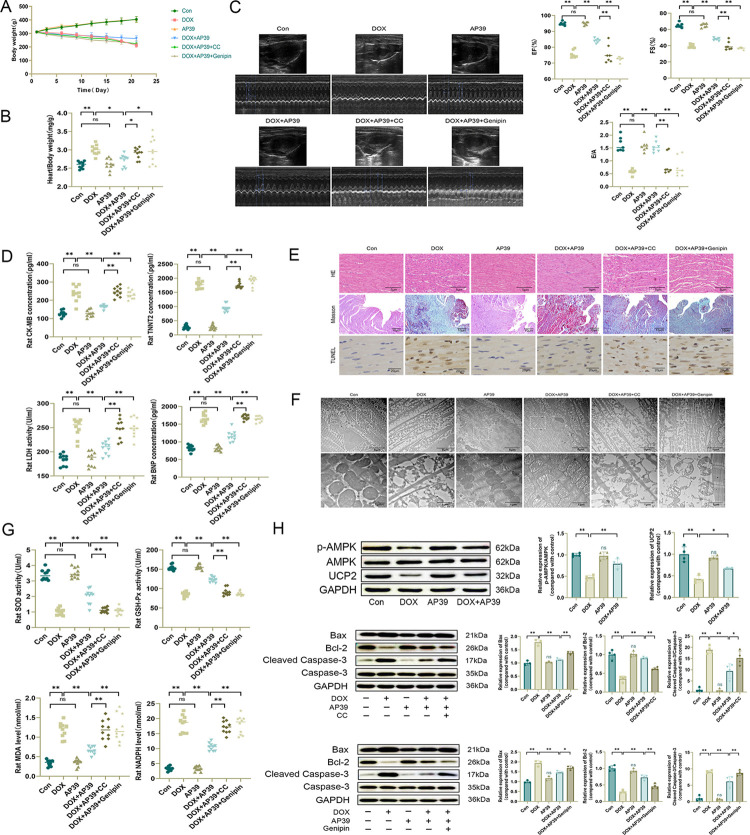
Fig 7. AP39 ameliorates DOX-induced cardiotoxicity in rats by regulating the AMPK/UCP2 pathway.
(A) Body weight in different groups of rats (n = 10); (B) Heart/body weight ratio in different groups of rats (n = 10); (C) Representative echocardiographic images and quantitative analysis of EF%, FS%, and E/A (n = 7); (D) Serum TNNT2, CK-MB, LDH, and BNP levels in rats (n = 10); (E) Representative HE, Masson and TUNEL staining images of the rat myocardium;(F) Representative images of mitochondria in rat cardiomyocytes observed by transmission electron microscopy; (G) SOD, GSH-Px, MDA, and NADPH levels in rat serum (n = 10); (H) Westen blot detection of apoptosis-related protein, p-AMPK, AMPK and UCP2 levels and statistical results (n = 3 or 4). Values are presented as the mean±SD.*p<0.05,**p<0.01. NS indicates no significant difference vs. Con group.

