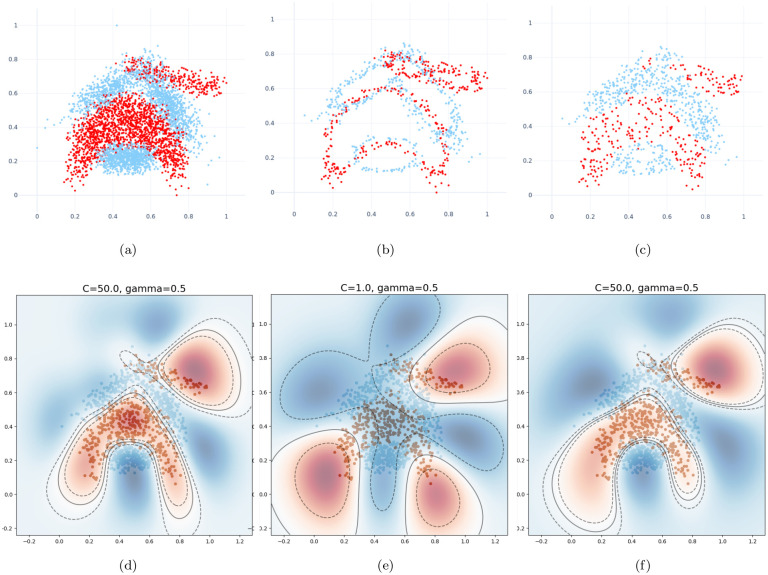
Fig 4. Effect of border overlap on the decision boundaries of the trained classifier on the Banana dataset.
The whole dataset is compared to our proposed DBI and BRIX methods, both at a ratio of 0.2. The test dataset is plotted against the decision boundaries (solid lines) and margins (dashed lines). (a) Whole dataset. (b) Reduced dataset (DBI). (c) Reduced dataset (BRIX variant). (d) Test dataset plot against decision boundaries (whole dataset). (e) Test dataset plot against decision boundaries (DBI). (f) Test dataset plot against decision boundaries (BRIX variant). Notice the misclassified points in the central region of the plot in (e) due to the overlapping borders of the opposite class around the central part.

