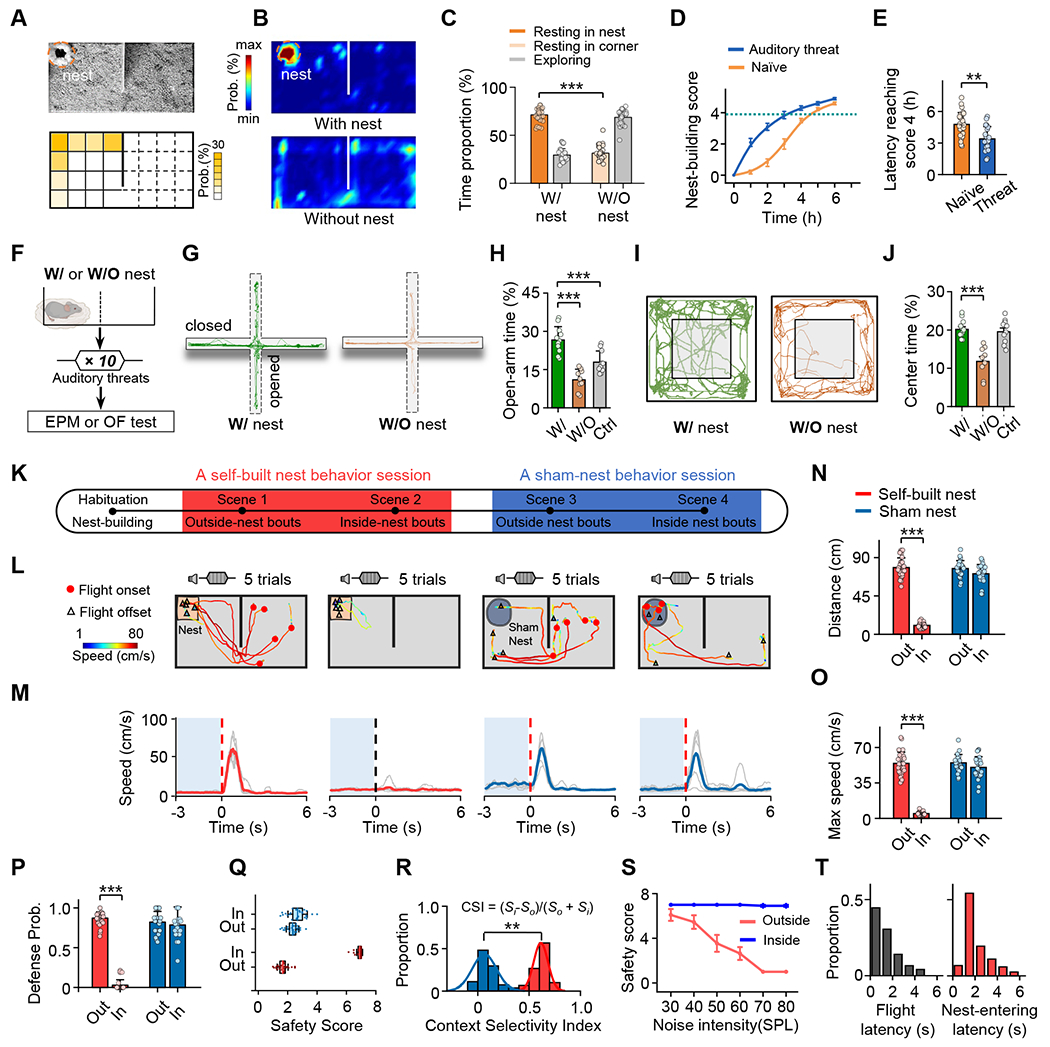
Figure 1.

Context-dependent fear responses upon auditory threats.
(A) Top, an example video frame showing the location of the self-built nest. Bottom, distribution of nest locations in the behavior arena. Mirror image was used if the location was on the right side.
(B) Heat map showing distribution of time in different locations of the arena with (top) or without (bottom) the self-built nest for an example mouse.
(C) Comparison of proportions of time staying in the nest (with the self-built nest present) and in a corner (with the nest absent). Grey, time outside the nest (with nest) or in the open area (without nest). Unpaired t test (***P < 0.001, t = 21, n = 30 mice each).
(D) Curve showing nest-building time for naïve mice (orange) and mice that had experienced auditory threats (blue).
(E) Comparison of the nest-building time reaching nest-building score 4 between for naïve mice (orange) and mice that had experienced auditory threats (blue). Unpaired t test (***P < 0.001, t = 4.15, n = 30, 20 mice for Naïve and auditory threat respectively).
(F) Experimental condition: a mouse staying in the arena with or without a self-built nest was exposed to auditory threat signals and after that was subjected to EPM and OF tests.
(G) Movements tracks for an example animal of with- and without-nest conditions in EPM test.
(H) Percentage of time spent in open arms of EPM. Unpaired t test (w/ nest vs. white control: t = 4.1, ***P < 0.001; w/ nest vs. w/o nest: t = 7.26, ***P < 0.001, n = 11, 9, 10 mice for w/ nest group, w/o nest group and white control group respectively).
(I) Movements tracks for example animals in OF test.
(J) Percentage of time spent in center of OF. Unpaired t test (w/ nest vs. w/o nest: t = 6.07, P < 0.001, n = 11, 9, 10 mice for w/ nest group, w/o nest group and white control group respectively).
(K) Schematic of experimental design. After habituation and nest-building, a self-built nest behavioral session under two scenarios (scene 1, noise stimulation was applied when the mouse was outside the self-built nest; scene 2, noise stimulation was applied when it was inside the nest) including 5–8 outside- and 5–8 inside-nest bouts were performed in a randomized order. Following that, in a subset of mice, a sham-nest behavioral session under two scenarios (scene 3 and scene 4) was also performed, similar to the self-built nest behavioral session.
(L) Trajectory with speed plot for an example mouse in each scenario (5 trials). Red dot, location at the onset of flight. Open triangle, location at the end of flight.
(M) Corresponding speed traces of single trials (light grey) and the mean (solid color) for the same mouse shown in (L), aligned to the onset of flight (red dotted line) or noise stimulation (black dotted line). Note that auditory threat was applied only if the mouse had remained relatively quiet for at least 3 seconds (shaded blue).
(N-P) Quantification of the total flight distance (N), maximum speed (O) and defense probability (P) in different scenarios. One-way ANOVA (***P < 0.001, ***P < 0.001 and ***P < 0.001; F = 369, 229 and 249 for (N), (O) and (P), respectively) and post hoc test, n = 30, 25 mice for self-built nest and sham nest respectively. All error bars represent s.e.m.
(Q) Boxplot of safety scores (see Figure S2 for scoring) in different scenarios. Red, for self-built nest; blue, for sham nest.
(R) Distribution of context selectivity indices (CSIs) for the self-built nest group (red) and sham nest group (blue). Kolmogorov-Smirnov test (***P < 0.001, D = 1.00), n = 30, 25 mice for self-built nest and sham nest respectively.
(S) Mean safety score plotted as a function of sound intensity for inside- (blue) and outside-nest (red) bouts, respectively.
(T) Distribution of onset latencies of flight (time from the noise onset to the flight onset, left) and latencies of nest-entering (time from the flight onset to the timing of nest-entering, right).
