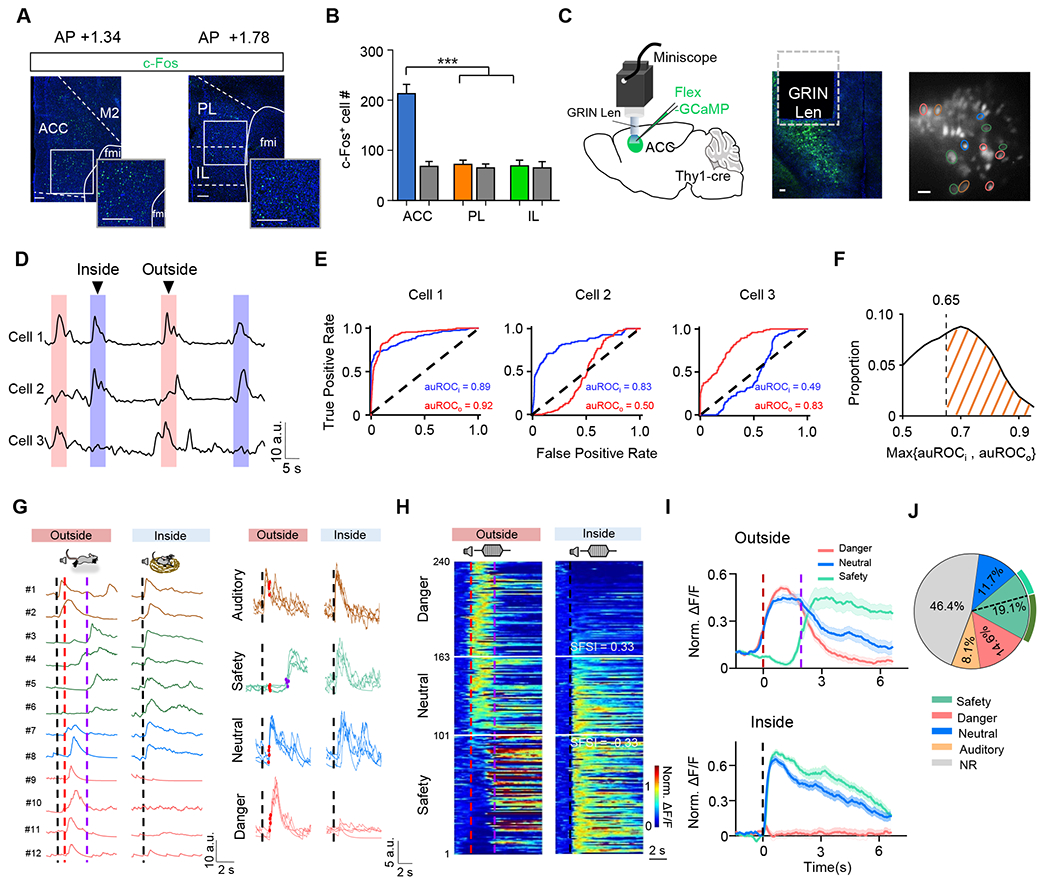
Figure 2.

Distinct danger- and safety-related neural representations in ACC.
(A) Image showing c-Fos staining in ACC (left), PL and IL (right) after inside-nest bouts. Blue, DAPI staining. Scale bar, 100 μm.
(B) Comparison of total numbers of c-Fos+ neurons among ACC, PL and IL. Kruskal-Wallis test (***P < 0.001, H = 19.50), n = 9 brain slices from 3 mice. Colored, experiment; gray, control.
(C) Schematic of micro-endoscopic calcium imaging (first panel) in ACC and an example confocal image showing GCaMP7s expression in deep layers of ACC (second panel). An example field of view (FOV) of GCaMP7s-expressing neurons (third panel). Scale bar, 100 μm.
(D) Three example cells showing different activation patterns in outside- and/or inside-nest bouts.
(E) The auROC of the example cells shown in (D) in outside- (red) and inside-nest (blue) bouts, respectively.
(F) Distribution of the largest auROC between outside- and inside-nest bouts for all individual cells. The dashed line indicates the auROC threshold (0.65) for defining event-related neurons.
(G) Left, Ca2+ signal traces for example auditory- (cell #1-2, brown), safety- (cell #3-6, green) and danger- (cell #9–12, purple) responding, as well as neutral (cell #7–8, blue) cells from the same FOV shown in (C), aligned to the noise onset. Note that a 5-point smoothing calculation was performed on each trace. Dashed black line, noise onset; dashed red line, flight onset; dashed purple line, timing of nest-entering. Right, single-trial Ca2+ response traces of example cells for each type. Red dot marks the onset of flight, and purple dot (safety) marks the timing of nest-entering. Note that the signal traces are after interpolation for alignment (see Figure S3E–S3J for details).
(H) Heatmap of normalized Ca2+ signal traces for danger-responding, safety-responding and neutral cells in two scenarios, sorted by SFSI (SFSI = (Po −Pi) / (Po + Pi), where Pi and Po were the peak amplitudes of the normalized Ca2+ activity during inside- and outside-nest bouts, respectively; also see STAR Methods) and aligned to the flight onset (dashed red line) in outside-nest bouts (left) or noise onset (dashed black line) in inside-nest bouts (right). Horizontal white lines mark the SFSI thresholds for neural classifications.
(I) Average normalized responses of danger-responding (n = 77 cells), safety-responding (n = 101) and neutral (n = 62) cells shown in (E).
(J) Proportions of safety-, danger-, and auditory-responding, neutral as well as non-responding (NR) cells. Dashed black line separates safety-responding population with (63.8%) and without (36.2%) showing nest-entering responses.
