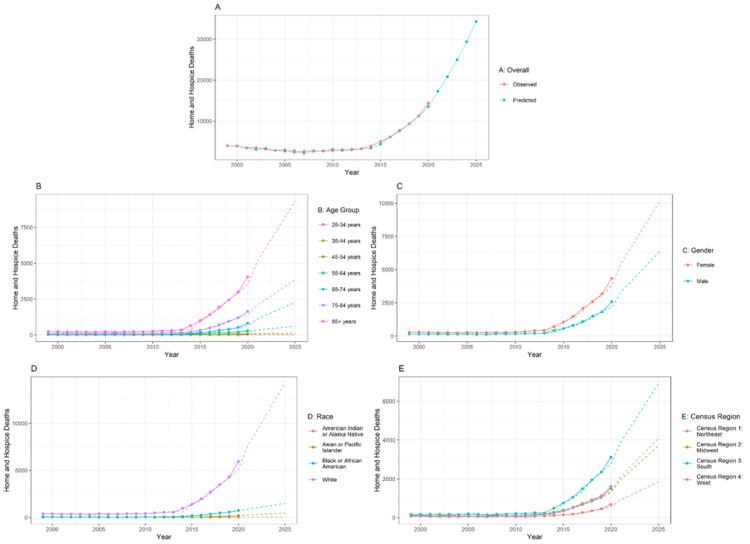
Figure 1. Cumulative home or hospice death trends in case of malnutrition from 1999-2020.
The forecasting for A is done from the year 1999 to 2025. The training data is available from the year 1999 to 2020. So, the prediction is done for another five years. In the line chart, the lines represent the observed data. The dotted line represents the forecasted data. The statistical method used for forecasting is the autoregressive integrated moving average (ARIMA) model

