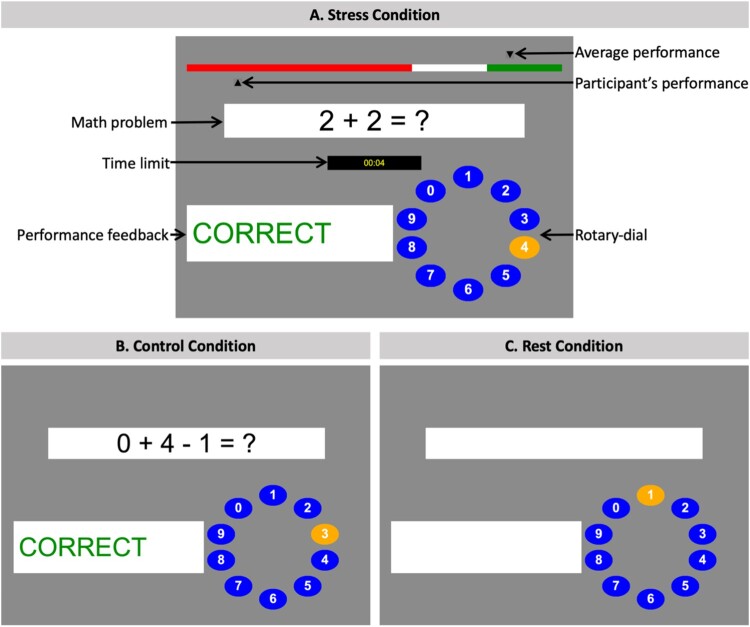
Figure 2.
Graphical user interfaces of the Montreal Imaging Stress Task.
Note. (A) Stress condition: from top to bottom, the figure shows the performance bar displaying the average performance of previous participants (artificially set to 80%) as well as the participant’s current performance. Below, participants were presented with math problems of varying difficulty whilst being shown the titrated time limit, they had to provide a response. A response was submitted via the rotary-dial (answer choices between 0 and 9). Finally, participants received trial-by-trial on screen performance feedback (‘correct’ in green, ‘error’ in red, or ‘timeout’ in yellow). (B) Control condition: participants answered math problems of the same difficulty level and received trial-by-trial performance feedback (‘correct’, ‘error’). However, no time constraints were enforced, the performance bar was not displayed, and participants were instructed that their performance would not be recorded. (C) Rest condition: participants were presented with the empty task interface and asked to keep their eyes open and not press buttons until the next math problem would appear.

