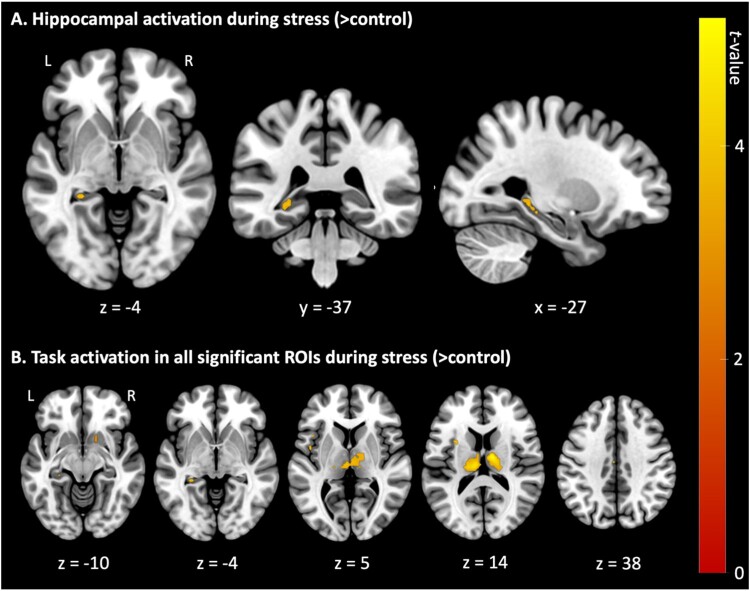
Figure 6.
Overview of neural activation during acute psychosocial stress (> control).
Note. Displayed are t-values of neural activation (pFWE < .05) during stress (> control) trials of the Montreal Imaging Stress Task. Results are presented (A) centred at the left hippocampus region of interest (MNI coordinates: x = −27, y = −37, z = −4) and (B) as axial slices with corresponding z-coordinates. L = left; R = right.

